Bitcoin Cash (BCH/USD) Market Moves Downward at $400
Estimated Reading Time: 3 minutes
Don’t invest unless you’re prepared to lose all the money you invest. This is a high-risk investment and you are unlikely to be protected if something goes wrong. Take 2 minutes to learn more
Bitcoin Cash Price Prediction – January 7
The BCH/USD market moves downward at $400 briefly. The crypto-economic price is trading around $388 at a negative percentage rate of about 2.84.
BCH/USD Market
Key Levels:
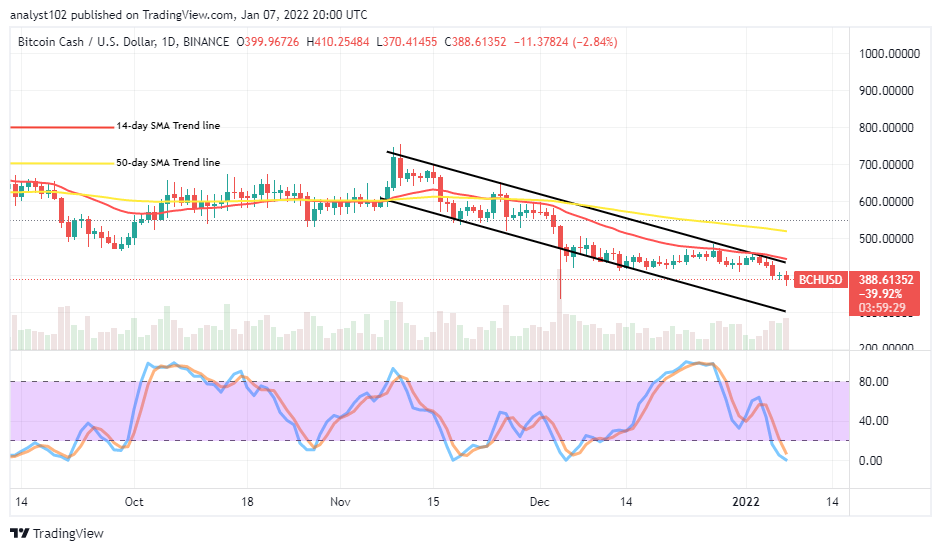
Resistance levels: $500, $600, $700
Support levels: $350, $300, $250
BCH/USD – Daily Chart
The BCH/USD daily chart reveals that the crypto market moves downward at the $400 level as paired with the US Dollar under the trend line of the smaller SMA. The 50-day SMA indicator is above the 14-day SMA indicator. The upper bearish trend line remains firmly drawn around the smaller SMA at the end. The Stochastic Oscillators are dipped into the oversold region, closely trying to make a touch with the zero range line. That signifies that the pressure on the crypto economy is yet to be over.
Will the BCH/USD price be down more as the crypto market moves downward at $400 briefly?
It seems that the crypto-economic trading operations are generally beginning to enter a change of cycle, denoting a return of bearish trend. And, in that wise, the BCH/USD price may go further down for a while as the crypto market moves downward at $400 briefly as of writing. Price may rally from around $350 or $300 after downing. If that scenario materializes, bulls will recover some of their lost momentums. After a while, the price may encounter resistance at $500 that can push back the market.
On the downside of the technical analysis, the BHC/USD market operations may stay under depressive trading conditions around the trend line of the smaller SMA for some sessions if the crypto-economic price has entered a downward trading cycle. In the continuity of that trading bias, the subsequent support levels will have to breach either forcefully or in a less-steady moving style. 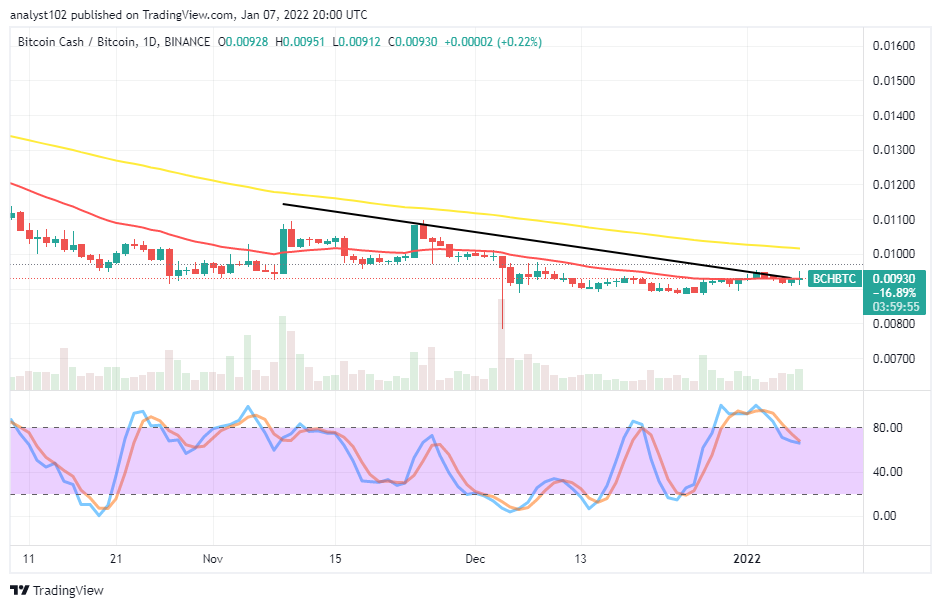
BCH/BTC Price Analysis
In comparison, Bitcoin Cash is still making inactive efforts to push against the trading stances of Bitcoin over time until now. The cryptocurrency pair market moves downward alongside the trend line of the smaller SMA. The 50-day SMA indicator is above the 14-day SMA indicator. The bearish trend line drew closely over the trend line of the smaller SMA. The Stochastic Oscillators have slightly moved southbound from the overbought region against the range of 80. And they now attempt to close the lines beneath it. That indicates that the base crypto pair price may still push in alignment with the smaller SMA trend line to the southward direction.
Note: Cryptosignals.org is not a financial advisor. Do your research before investing your funds in any financial asset or presented product or event. We are not responsible for your investing results.
You can purchase crypto coins here. Buy Tokens