Bitcoin Cash (BCH/USD) Market Trades at $600
Estimated Reading Time: 3 minutes
Don’t invest unless you’re prepared to lose all the money you invest. This is a high-risk investment and you are unlikely to be protected if something goes wrong. Take 2 minutes to learn more
Bitcoin Cash Price Prediction – August 13
There have been more or less sideways movements in the BCH/USD operations as the crypto market trades around $600. The finance book of records shows that the crypto economy trades at a percentage rate of 3.24% increases.
BCH/USD Market
Key Levels:
Resistance levels: $700, $900, $1,100
Support levels: $500, $400, $300
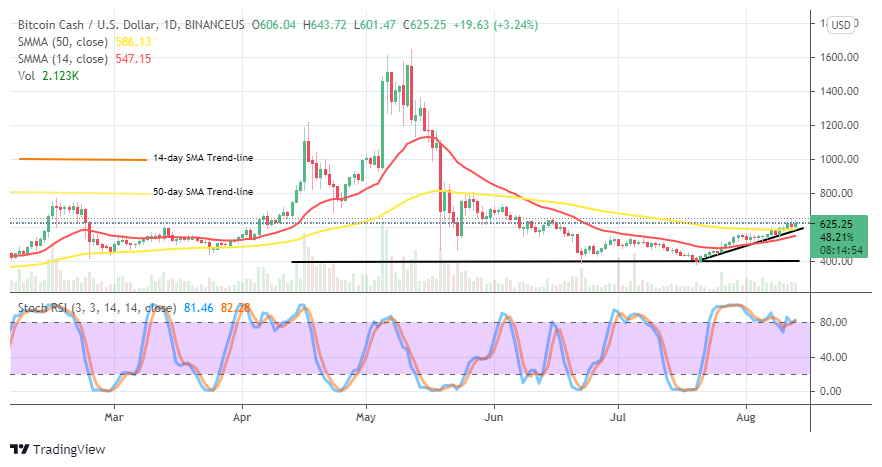
BCH/USD – Daily Chart
The BCH/USD daily chart has revealed that the crypto market trades around the level of $600, following a trade operation characterized by smaller candlesticks near above the trend-line bigger SMA. The bullish trend-line drew from the base support critical line at $400 to $600 to markup point that a falling force may form. The Stochastic Oscillators are in the overbought region, moving in a consolidation manner marked with no definite course. That portends a warning against any exerting of position as of writing.
When should traders determine a coming back to the BCH/USD operations as the market trades around $600?
The use of market formation on the 1-hour and 4-hour charts will most probably allow traders to determine when there will be the next price action direction. A slowly pulling down of the market’s valuation to some extent of lower trading levels will allow the crypto’s price to take a hike to form a bullish signal candlestick from the lower point. While that assumption takes place, bulls will definitely make new decent upswings that could surpass $600.
However, it portends by the Stochastic Oscillators that the market’s next direction may favor more downs for a while. Based on that technical projection, the BCH/USD market bears needed to be cautious of their proceedings. In the meantime, an eventual interception of the 50-day SMA trend-line by the 14-day SMA trend-line could put the market into getting timely rebounding whenever a downward move tends to fake out.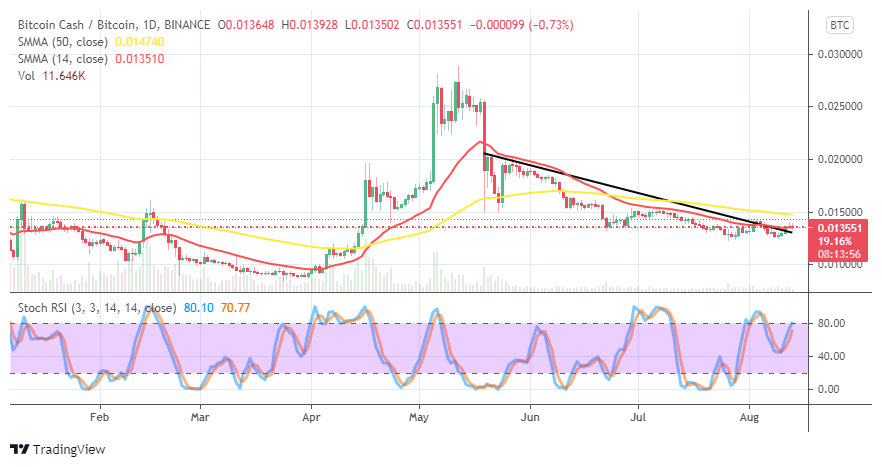
BCH/BTC Price Analysis
There has been a continued long line of price lowering on a smaller rate pace on the BCH/BTC price analysis chart. The 50-day SMA trend-line is above the 14-day SMA trend-line. And, the bearish trend-line drew downward to share the same point around the smaller SMA. The Stochastic Oscillators seem to make an attempt to close the lines around range 80. It appears that the base crypto doesn’t have a stronger stance to trend forcefully as paired with the flagship counter trading crypto.
Note: Cryptosignals.org is not a financial advisor. Do your research before investing your funds in any financial asset or presented product or event. We are not responsible for your investing results.
You can purchase crypto coins here. Buy Tokens

