Bitcoin Cash (BCH/USD) Market Trades in Lower Lows
Estimated Reading Time: 3 minutes
Don’t invest unless you’re prepared to lose all the money you invest. This is a high-risk investment and you are unlikely to be protected if something goes wrong. Take 2 minutes to learn more

Free Crypto Signals Channel
Bitcoin Cash Price Prediction – July 1
The BCH/USD trade maintains a tight closure in its feeble motions to the north direction as the crypto market trades in lower lows. Price is minimally trading a bit over the $100 support line at a negative percentage rate of 2.58.
BCH/USD Market
Key Levels:
Resistance levels: $125, $150, $175
Support levels: $100, $80, $60
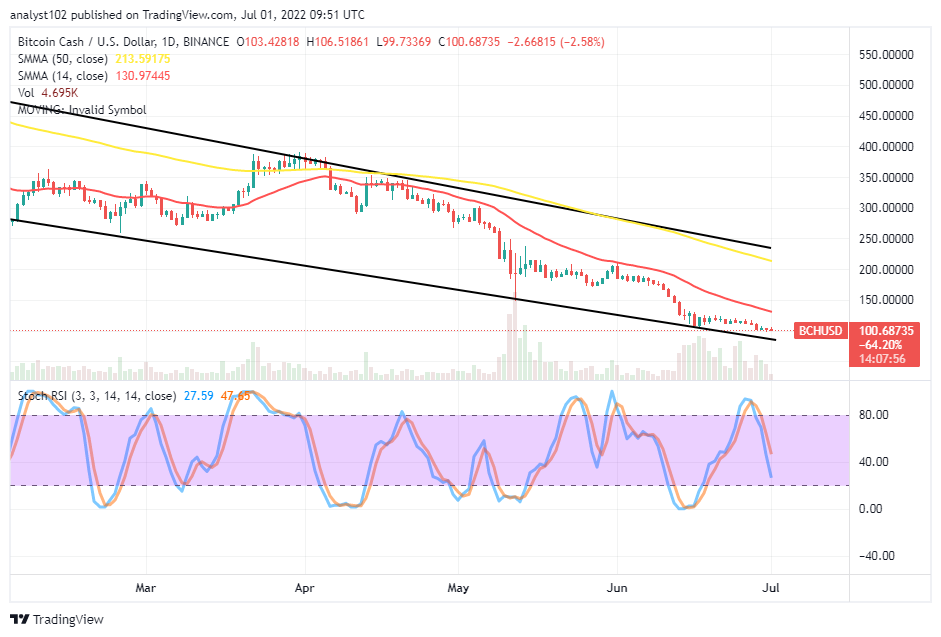
BCH/USD – Daily Chart
The BCH/USD daily chart reveals the crypto market trades in lower lows toward the trend line of the lower bearish trend line. The 14-day SMA indicator is above the current trading spot underneath the 50-day SMA indicator. There is now a notable vast space between the SMAs. The Stochastic Oscillators have crossed southbound from the overbought region, briefly past the 40 range. And they are still pointing down.
Will the BCH/USD market decline further as it trades in lower lows?
The declining moving mode in the BCH/USD market operations has been on a weak outlook as the crypto market trades in lower lows. As the price has reached a low around the $100 support level, long-position takers may look out for a rebound if it has not breached fearfully in the process. Buying orders can be with the most lot size position to run upside for profits in the long-term rum.
On the downside of the BCH/USD market technical analytics write-up, as there have been low-active motions to the downside, short-position takers have to exercise caution to avoid the possibility of re-occurrence of a rebound around the $100 support level. It would be an offcut of a technical trading approach to launch heavy selling orders at the expense of fearful breaching below the value line.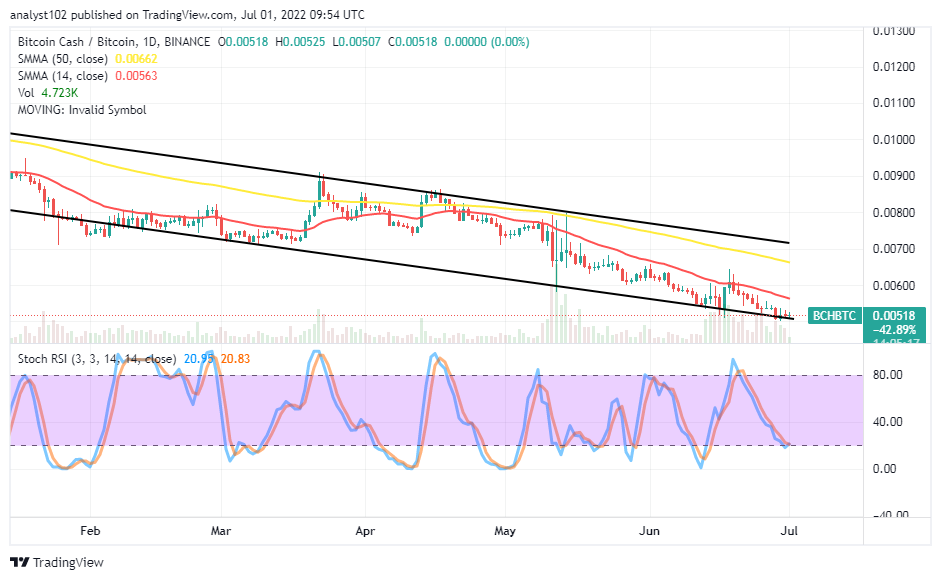
BCH/BTC Price Analysis
Bitcoin Cash trade valuation features at a lower-trading spot against the trending capacity of Bitcoin. The cryptocurrency pair price trades in lower lows to the point of the lower bearish trend line. The 14-day SMA trading indicator is underneath the 50-day SMA indicator. The Stochastic Oscillators have crossed southbound to the range line at 20. And they are seemingly attempting to close around the range point. It appears the base crypto has pushed to the value line expected to regain its lost trending force against its counter-trading instrument.
Note: Cryptosignals.org is not a financial advisor. Do your research before investing your funds in any financial asset or presented product or event. We are not responsible for your investing results.
“Lucky is up more than 50% today but still more than 430% from All Time Highs!
The opportunity to bank BIG is now!
You can purchase Lucky Block here. Buy LBlock