Bitcoin Cash (BCH/USD) Price Beefs up the Energy Beneath $350
Estimated Reading Time: 3 minutes
Don’t invest unless you’re prepared to lose all the money you invest. This is a high-risk investment and you are unlikely to be protected if something goes wrong. Take 2 minutes to learn more

Free Crypto Signals Channel
Bitcoin Cash Price Prediction – April 15
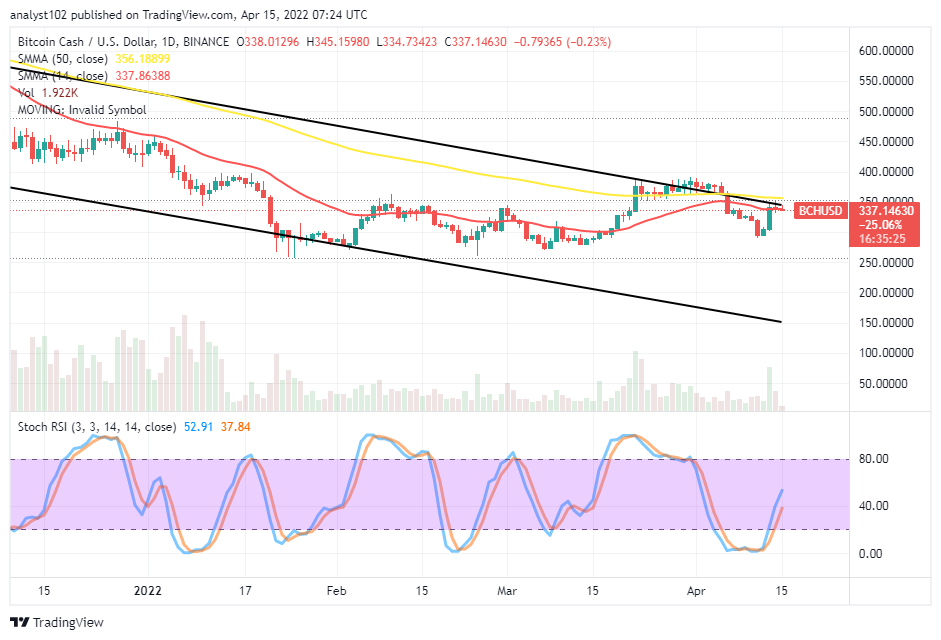
The last retracement-moving exercise in the BCH/USD market operations has led the transaction to get support at a lower spot. And currently, the crypto-economic price beefs up the energy beneath $350, trading in the high and low of $345 and $334 at a minimal negative percentage of 0.23.
BCH/USD Market
Key Levels:
Resistance levels: $400, $450, $500
Support levels: $300, $250, $200
BCH/USD – Daily Chart
The BCH/USD daily chart reveals the crypto-economic price beefs up the energy beneath the $350 trading level after it found support around the $300 level from a correctional-moving motion lately. The 14-day SMA trend line is closer to the 50-day SMA trend line. And they are near the value-line earlier mentioned. The Stochastic Oscillators have crossed the lines northbound slightly against the range of 40, signifying more degrees of upward forces to surface afterward.Will the BCH/USD market valuation get past the $350 as the crypto-economic price beefs up the energy beneath it?
The April 13th bullish candlestick emerged, bottoming closely above the $300 in a confirmation mode to get more ups from that spring-up in the subsequent operations as the crypto-economic price beefs up the energy beneath the $350 resistant trading point. To further thrash out some trading techniques from the present trading outlook, the trade has had a deep-rooted baseline built around $250. And that value-line will serve as the critical trading line to any free-fall that may occur hugely in the transactions between BCH and the US Dollar afterward.
On the downside of the technical analysis, the BCH/USD market short–position takers may have to stay alert, trying to spot a weakness of the crypto’s price failing to push past the $350 level sustainably before deciding to go again for a shorting order positioning. And they needed to exercise some degrees of levities exerting such a decision.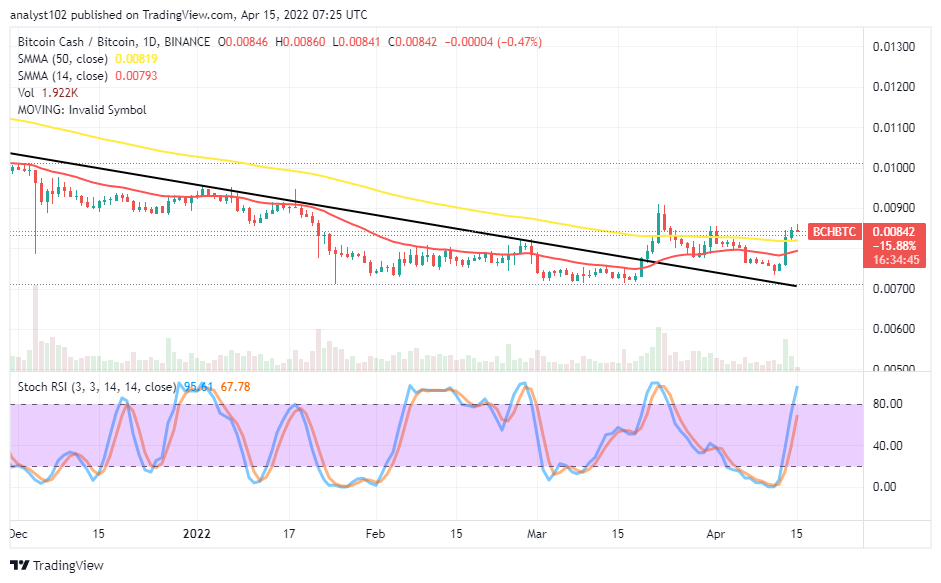 BCH/BTC Price Analysis
In comparison, Bitcoin Cash trades against Bitcoin above the bearish trend line. The 50-day SMA indicator is above the 14-day SMA indicator. The bearish trend line drew southward, positioning underneath the SMA trend lines at the lower end. The Stochastic Oscillators have swerved northbound briefly past the range of 80 into the overbought region to indicate the base crypto instrument is striving to push against the trending force of the flagship counter crypto economy. However, the situation appears that some upward pressures may not sustain in the long-term run of the current motion to the upside.
Note: Cryptosignals.org is not a financial advisor. Do your research before investing your funds in any financial asset or presented product or event. We are not responsible for your investing results.
You can purchase Lucky Block here. Buy LBlock: