Bitcoin Cash (BCH/USD) Valuation Lowers, Averaging $500
Estimated Reading Time: 3 minutes
Don’t invest unless you’re prepared to lose all the money you invest. This is a high-risk investment and you are unlikely to be protected if something goes wrong. Take 2 minutes to learn more
Bitcoin Cash Price Prediction – November 26
There has been an increase in the BCH/USD market declination in the range-bound zones as the crypto-economic valuation lowers, averaging a $500 lower-range support line. The crypto’s percentage rate of trading is estimated at around 8.45 negative as the price witnesses a volume of about $564 worth as of writing.
BCH/USD Market
Key Levels:
Resistance levels: $700, $800, $900
Support levels: $500, $400, $300
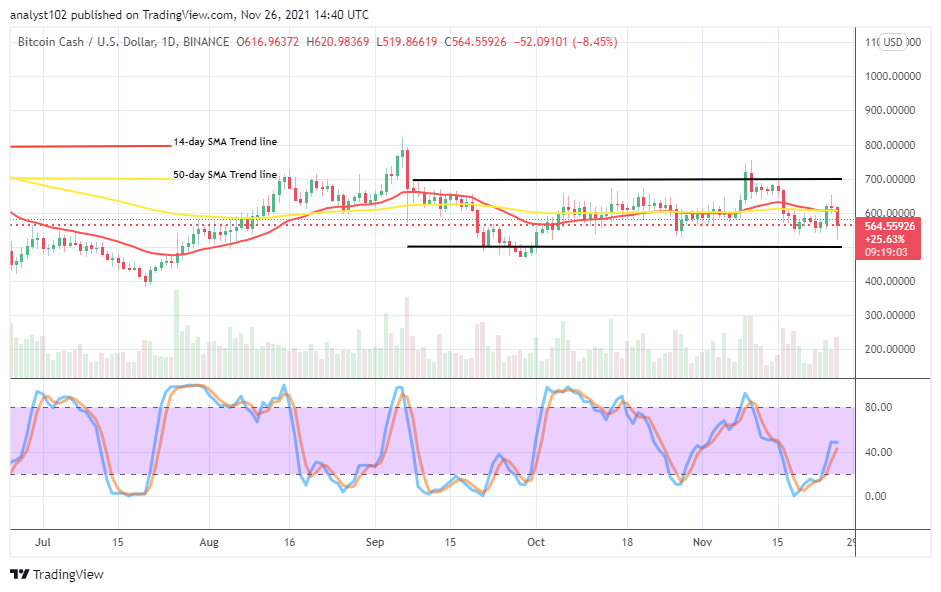
BCH/USD – Daily Chart
The BCH/USD daily chart shows that the crypto-economic valuation lowers, averaging $500 support level, also the lower-range value-line during today’s session. There has been a conjoining formation outlook between the 14-day SMA indicator and the 50-day SMA indicator in the range-bound spots marked by $700 and $500. That suggests that the ranging emotions are still somewhat valid in the present trading situation of the market. The Stochastic Oscillators have moved northbound from the oversold region, now try to close the lines a bit over the range of 40. That could mean the crypto’s price may still go lowering for a while, possibly around the lower-range level.
Has there been a decent psychological-trading trait for buyers to exert positions as the BCH/USD market valuation lowers, averaging $500?
There might be a decent psychological trading trait for buyers to exert long position orders as the BCH/USD market valuation lowers, averaging a $500 lower-range level in today’s trading situation. However, it still appears that some lowering moments will have to play out in a brighter full-fledged pattern, especially if the end formation result of today’s candlestick carries a higher bearish body than been rallying to signal a return of upswings afterward.
On the downside, the BCH/USD market sellers may still have to hold back their stances around $600 mid-range level to descend more energy against any possible attempt made by the market to push past the value line. Failure to that assumption to occur, the higher-range level at $700 will have to be the trading area to look out for to execute that market projection attitude when price tends to experience a pit stop that could potentially witness a depression around that point in the long run.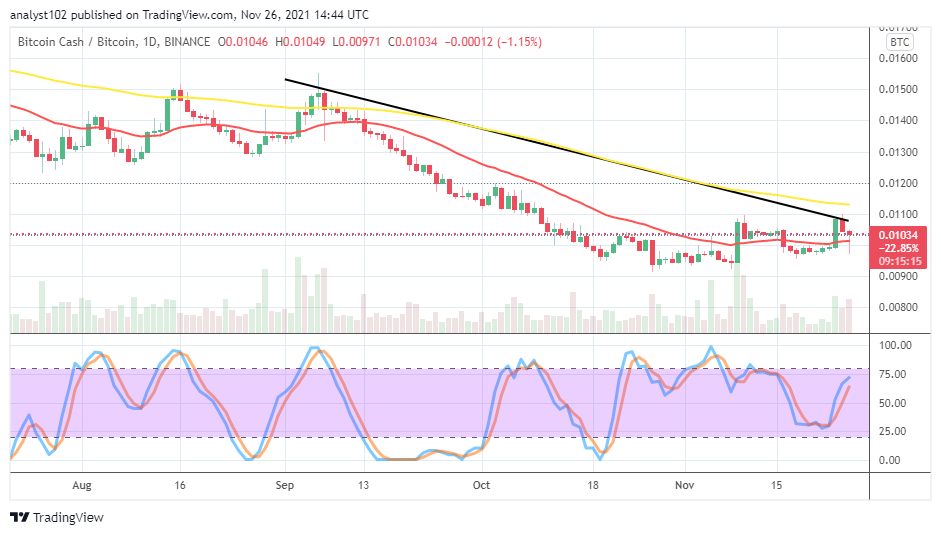
BCH/BTC Price Analysis
In comparison, the BCH/BTC price analysis chart reveals that the base crypto has initially managed to surge northward beneath the trend line of the bigger indicator. But, currently, the cryptocurrency pair valuation lowers, averaging some of the previous lower values. The 14-day SMA trend line is underneath the 50-day SMA trend line. The Stochastic Oscillators are close around the range of 75. And, they now seem, trying to close the lines. That signifies the need to play around the market by the extreme psyche of levities.
Note: Cryptosignals.org is not a financial advisor. Do your research before investing your funds in any financial asset or presented product or event. We are not responsible for your investing results.
You can purchase crypto coins here. Buy Tokens