Annual Forecast for Bitcoin (2022) BTC/USD
Estimated Reading Time: 3 minutes
Don’t invest unless you’re prepared to lose all the money you invest. This is a high-risk investment and you are unlikely to be protected if something goes wrong. Take 2 minutes to learn more
Bitcoin Annual Price Forecast
Since the inception of Bitcoin as the first-ever crypto-economy, trading against some other instruments has been mooning more than downing. As this year has just freshly started, the market on its annual forecast financial record has witnessed a higher value-line of $48,102 and a lower point of about $39,672 on the percentage average of around 7.77 negatives.
BTC/USD Market
Key Levels:
Resistance levels: $50,000, $60,000, $70,000
Support levels: $40,000, $30,000, $20,000
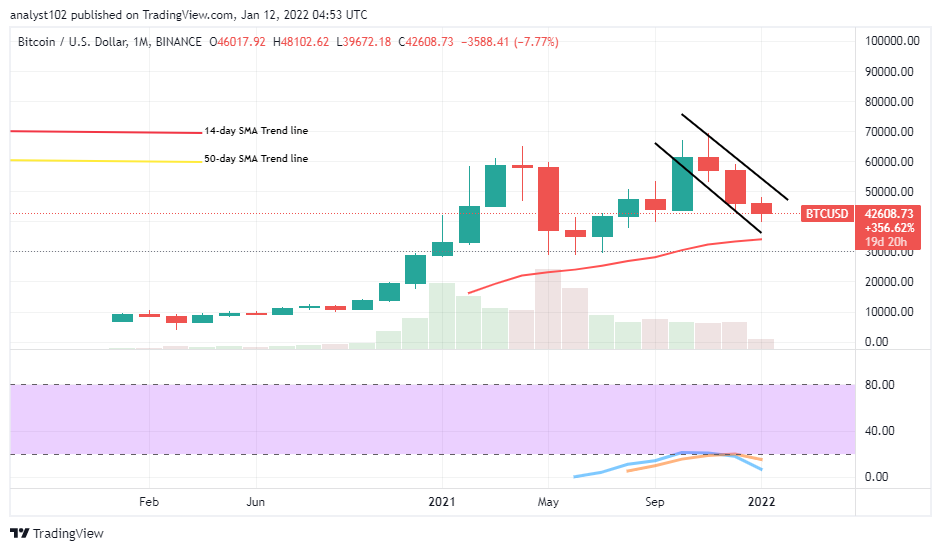
BTC/USD – Daily Chart
The BTC/USD monthly trading chart showcases the crypto-economic on the annual forecast analytical point of viewing as it is running on a bearish trend outlook. The downward motion began during the last year’s November session when the price hit resistance at the $70,000 level toward averaging the SMA indicator, which positioned a bit above the $30,000 support level. That indicates a massive reduction in the market. The Stochastic Oscillators have crossed their lines southbound against the range of 20 to signify that the crypto business activities are under a depressive condition.
Will there still be room for more downs in the BTC/USD market’s annual forecast?
Based on the current trading trend outlook, the BTC/USD market annual forecast for the year2022 is likely to suffer setbacks in its bid to make variant tangible upswings. The maximal higher recovery of the crypto’s price may not exceed between the levels of $50,000 and $60,000 even there’ll be volatility featuring in the subsequent pushing efforts against the US currency. A line of rebounding moves is likely to come up between the levels of $40,000 and $30,000 while the present depression tends to elongate.
On the downside of the technical analysis, resistances closely beneath the $50,000 level have to be maintained by bears by not allowing price break out for sustainability to convincingly keep the change of trading cycle in its expected direction. A line of price rallying motions is bound to occur up to a higher certain point before a fearful reversal moves to resurface.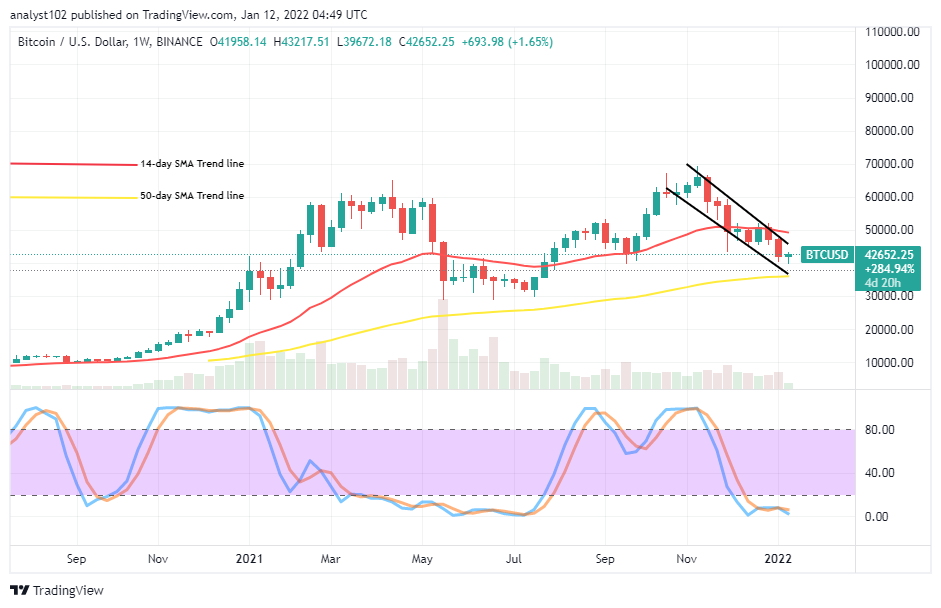
BTC/USD Weekly Charts
The BTC/USD weekly chart also showcases the crypto economy running in a bearish outlook currently based on the annual forecast trading style. The 14-day SMA indicator is above the 50-day SMA indicator. The bigger SMA positioned around $35,000, as the smaller SMA placed at $50,000, showcasing the higher value-line as the resistance spot of the present falling pressures. The Stochastic Oscillators are in the oversold region, seemingly attempting to open toward the south direction within at a closer range to zero line. That signifies that some downward forces are still in place. Therefore, traders should be wary of launching long position orders. On the note of the market consolidating around $40,000 level, price is liable to drop more to a lower support trading line of around $30,000 or extending to $20,000 before the end of this year.
Note: Cryptosignals.org is not a financial advisor. Do your research before investing your funds in any financial asset or presented product or event. We are not responsible for your investing results.
You can purchase crypto coins here. Buy Tokens