Bitcoin (BTC/USD) Approaches Resistance of $40,000
Estimated Reading Time: 3 minutes
Don’t invest unless you’re prepared to lose all the money you invest. This is a high-risk investment and you are unlikely to be protected if something goes wrong. Take 2 minutes to learn more
Bitcoin Price Prediction – June 3
Over a couple of notable trading days’ sessions back now, the market of Bitcoin pairing the US Dollar has mostly traded around or a bit below the resistance level of $40,000. Price, as of writing, trades around the value of $37,878 with about a 3.90% increase.
BTC/USD Market
Key Levels:
Resistance levels: $40,000, $45,000, $50,000
Support levels: $35,000, $30,000, $25,000
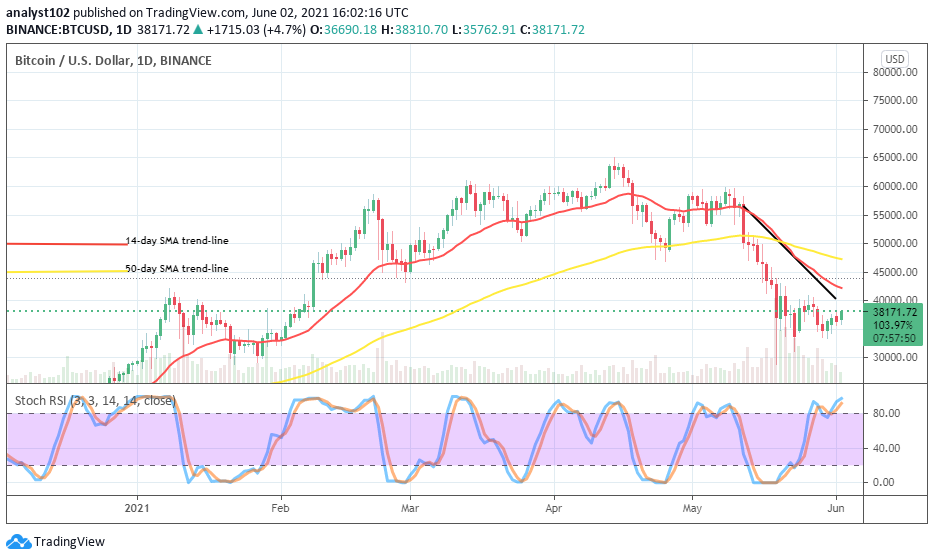
BTC/USD – Daily Chart
From May 30 until the present trading time, the BTC/USD daily chart depicts a line of short bullish candlesticks emerging in the market from around the point of $35,000 to average the upper trading level of $40,000 that has been a key resistance line over the time. The 50-day SMA indicator is still located over the 14-day SMA trend-line as the bearish also remains positioned downward to put a markdown at the immediate resistance line of the crypto economy. The Stochastic Oscillators are in the overbought region seemingly attempting to close the blue line with the red line in it. That, in the long run, could mean that there may soon be a consolidation movement in the market.
How long will the BTC/USD continue featuring around or below the resistance of $40,000?
It may still take the two major players some more time to push the BTC/USD trade in a definite direction. From the technical viewing point, bulls are yet seemingly not beefing up with the much-needed energy to continually surge past the resistance of $40,000 sustainably. The indicator-weighing the market strength has shown an overbought trading situation to portend a warning signal especially against entering a buy order without exercising a good principle of money management.
An upsurge extending purposely to have a test of a point around the smaller SMA trend-line will potentially lead back the market for a reversal against the key point of $40,000 once again. To some extent, it appears that there are more sessions to go seeing a persistence of range-bound trading style. While that assumption plays out, the point earlier mentioned will be the major focus area for selling positions.
BTC/USD 4-hour Chart
On the medium-term chart, it still depicted to some extent that Bitcoin’s value is still under a force as paired with the USD Dollar. In the meantime, the chief base crypto seems struggling to push for recoveries with a less-impulsive price action that has it to trade mostly around the trend-line of the smaller SMA. All the indicators are now bent downward to place in the levels of $36,000 and $40,000. The bearish trend-line drew in between the 14-day and the 50-day SMA trend=lines. The Stochastic Oscillators are in the overbought with an attempt to close the lines. That could be a warning signal to bring a pause to an upward move at a closer higher point around the immediate resistance level in no time.
Note: new.cryptosignals.org is not a financial advisor. Do your research before investing your funds in any financial asset or presented product or event. We are not responsible for your investing results.