Bitcoin (BTC/USD) Breaks down the $45,000 Support
Estimated Reading Time: 3 minutes
Don’t invest unless you’re prepared to lose all the money you invest. This is a high-risk investment and you are unlikely to be protected if something goes wrong. Take 2 minutes to learn more
Bitcoin Price Prediction – May 19
The current extension of downward pressure has spanned from what formerly looked a correctional has now metamorphosed into an early-stage bearish trend. The crypto is presently priced lowly at around the value of $43,069 at -1.13%.
BTC/USD Market
Key Levels:
Resistance levels: $50,000, $55,000, $60,000
Support levels: $40,000, $35,000, $30,000
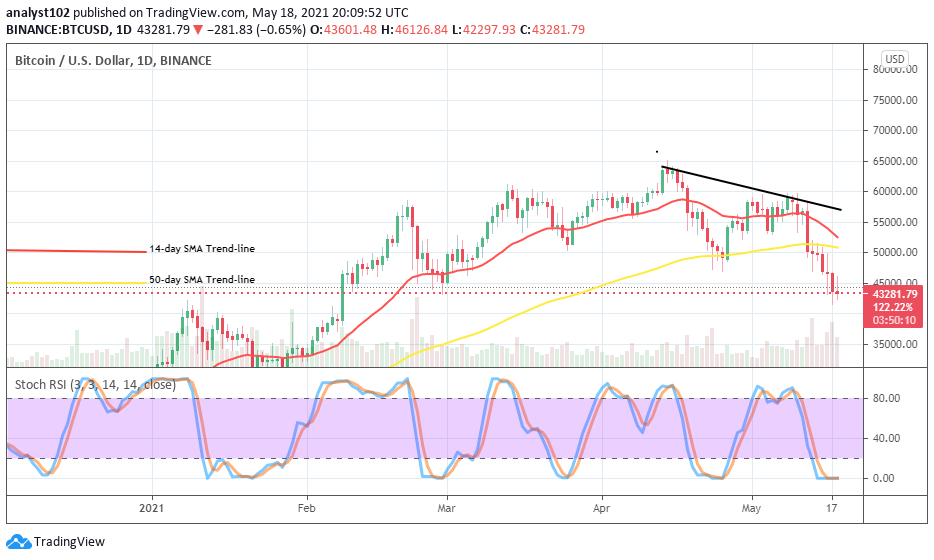
BTC/USD – Daily Chart
It is now depicted on the BTC/USD daily chart that the point at $50,000 has breached southward on May 15 to now become an immediate resistance line of the crypto economy. And, the downward pressure seems not to have exhausted as the level of $45,000 is experiencing some risky falling forces that could potentially extend the downward more. The 14-day SMA trend-line is bent down towards the 50-day SMA from the top. The bearish trend-line is located above the SMAs as price trades far below them. The Stochastic Oscillators are dipped in the oversold region with close hairs. That could lead to a consolidation of bears’ movement at that trading level.
Will the BTC/USD price dump further?
Going by the reading of technical trading tools, the BTC/USD market level at $45,000 is most likely to experience a strong price consolidation moving moment that will mostly be in the favor of downward pressure for a while. Bulls, as at this time, need to be cautious of their coming-back until a bullish candlestick resurfaces to signal a decent entry for a buy order. Investors may now as well brace up for an opportunity while that sentiment plays out to consider joining the market in the long-term run.
On the account of getting to see more downward movements in this crypto trade, holding of a position strongly bears past below the point of $40,000 immediate support level is most needed to freely bring about more downs against the crypto’s stance. However, traders are also enjoined to wary of getting caged while price reveres sharply against late sell-entry.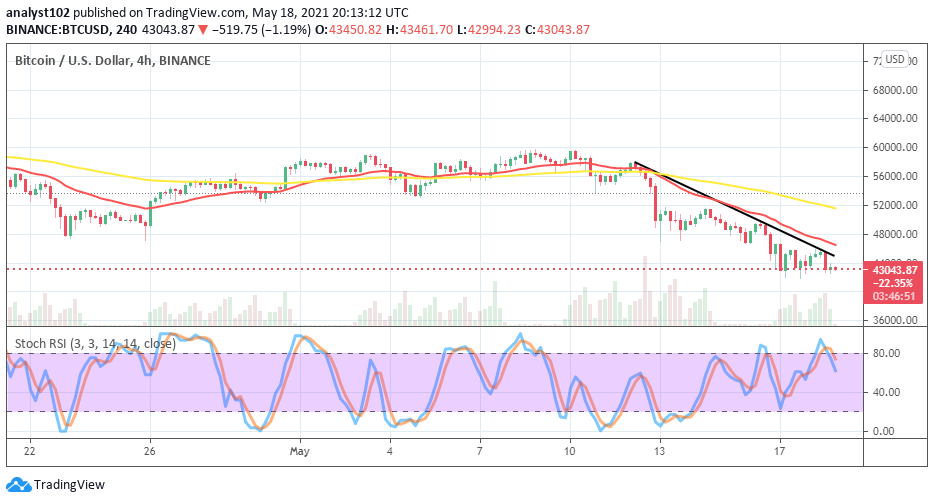
BTC/USD 4-hour Chart
The medium-term chart shows that the market operation that exists between the flagship cryptocurrency and the US Dollar is in a bearish moving outlook. On May 18, a strong support level of around $44,000 sees a downward pressure that can lead the market downward to find another lower support. The bearish trend-line drew below the 14-day SMA trend-line that is underneath the 50-day SMA indicator. And, they are all over the current downward trading zone. The Stochastic Oscillators are pointing towards the south to indicate that the market is still under dumping pressure. However, traders going in line with the current falling price pace of the market need to be very cautious of their entries at this time.
Note: cryptosignals.org is not a financial advisor. Do your research before investing your funds in any financial asset or presented product or event. We are not responsible for your investing results.