Bitcoin (BTC/USD) Finally Reaches Lower Support of $50,000 in a Downward Price Correction
Estimated Reading Time: 3 minutes
Don’t invest unless you’re prepared to lose all the money you invest. This is a high-risk investment and you are unlikely to be protected if something goes wrong. Take 2 minutes to learn more
Bitcoin Price Prediction – April 25
In the aftermath of the recent downward price correction of the BTC/USD, its market valuation has lowered down to the level expected to be the final trading point of extension around the value of $50,000.
BTC/USD Market
Key Levels:
Resistance levels: $55,000, $60,000, $65,000,
Support levels: $45,000, $40,000, $35,000
BTC/USD – Daily Chart
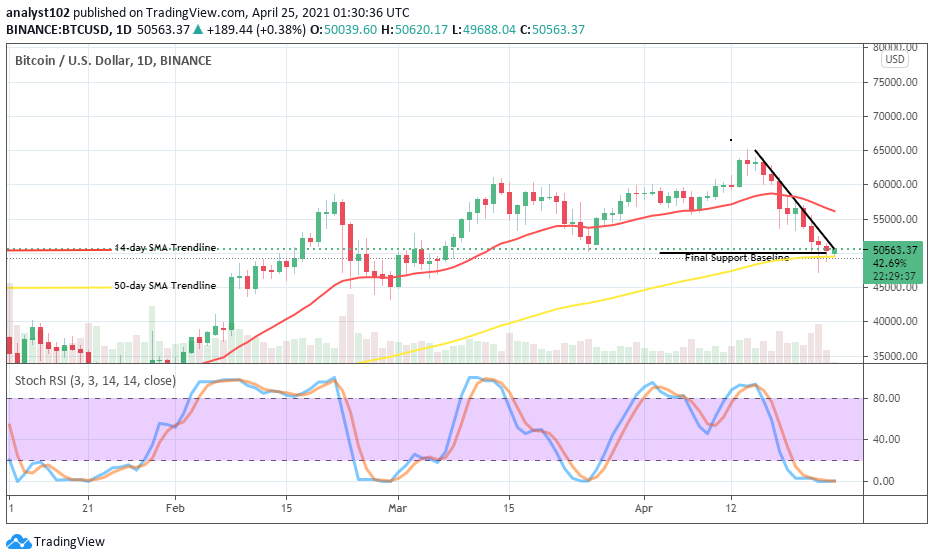
The BTC/USD daily chart currently depicts that the emergence of variant serial bearish candlesticks has had it breaking down past some critical levels of $55,000 and $50,000 past support levels. The $50,000 price level now stands to be the last level of bullish trend correction. The 50-day SMA trading indicator is as well located around the current trading zone with the 14-day SMA trend-line found a bit bent over it towards the south to signal an ongoing decline pressure in the market. The Stochastic Oscillators are dipped into the oversold region with conjoined hairs to consolidate within it. That indicates that the bearish move is yet to be exhausted.
Will there soon be a definite direction in the BTC.USD price from the $50,000 level?
As of writing, indications are having it not in clarity that there will be a well-defined directional move in the valuation of BTC/USD trading instrument in the near time. Meanwhile, at the level of $50,000, bulls are being on a higher note expected to firmly re-settle their baseline support to stage a come-back after a while. But, they need to wait for the emergence of a price spike before considering a decent re-entry order in this crypto-trade.
As the BTC/USD price has eventually lowered down to around the $50,000 level in what believes to be a correction movement, bears now have a full chance to take the advantage of the situation to launch back their presence in this crypto-economy. As a result, either a rejection at between the points of $50,000 and $55,000 or a forceful breakdown of the final support baseline will most probably be a confirmation of a full bearish trend resumption for this crypto-market.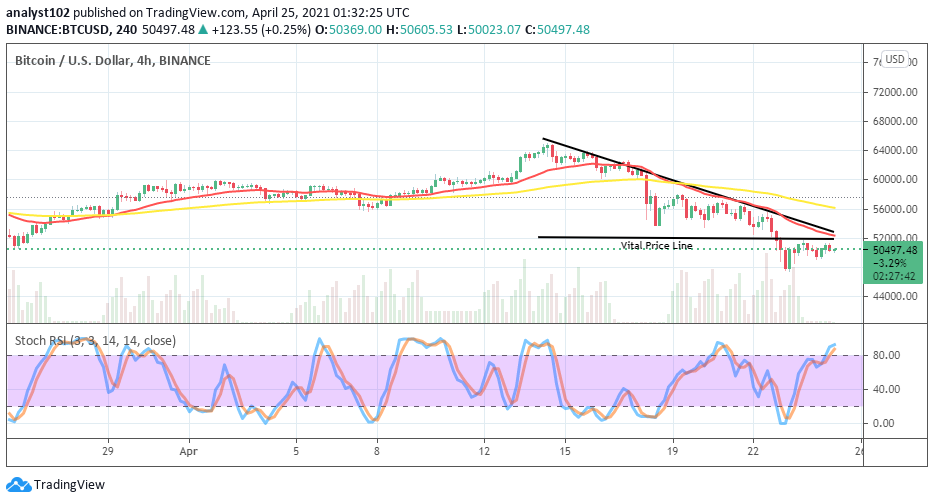
BTC/USD 4-hour Chart
The 4-hour trading chart shows that since April 14, the BTC/USD market valuation has been seeing a downward pressure. The vital price line of $50,000 has also breached to the south to signify the degree of the current medium-term pressures. The bearish trend-line has drawn along with the 14-day SMA trend-line crossing the 50-day SMA indicator to the south to showcase the state of the bears’ pushes capacity in the market. The Stochastic Oscillators have moved upward a bit past range 80 into the overbought region. They now portend a sign of a small loss in the bulls’ power. Therefore, bears may still have the market’s control for some more trading sessions. However, they should be wary of late entry to beat bears’ trap afterward.
Note: cryptosignals.org is not a financial advisor. Do your research before investing your funds in any financial asset or presented product or event. We are not responsible for your investing results.