Bitcoin (BTC/USD) Holds Tight Around $35,000 Value
Estimated Reading Time: 3 minutes
Don’t invest unless you’re prepared to lose all the money you invest. This is a high-risk investment and you are unlikely to be protected if something goes wrong. Take 2 minutes to learn more
Bitcoin Price Prediction – June 30
Many trading activities have been ongoing in the BTC/USD market around the levels of $35,000 and $30,000. Price tries to swing up to now trade at about a point of $34,918 at a minus percentage rate of 3.66.
BTC/USD Market
Key Levels:
Resistance levels: $37,500, $42,500, $47,500
Support levels: $30,000, $27,500, $25,000
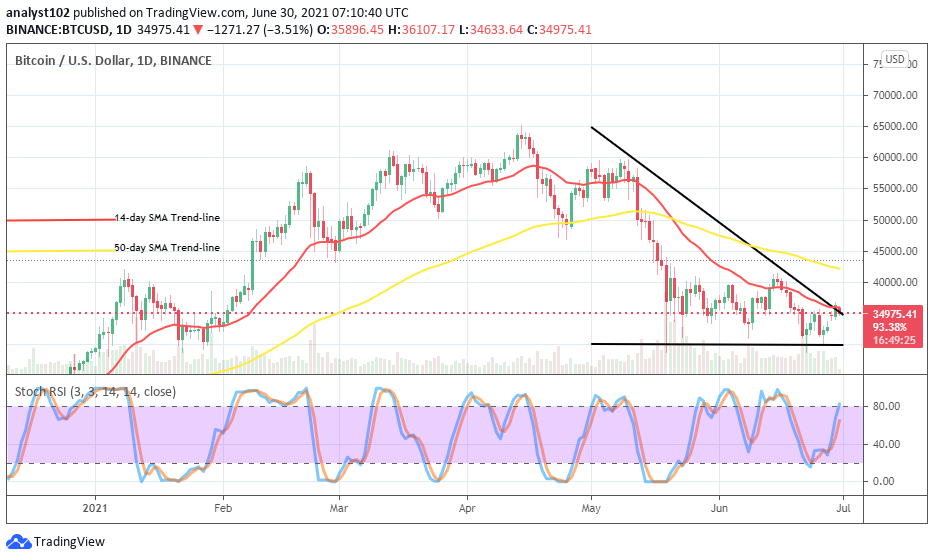
BTC/USD – Daily Chart
Technical readings of the BTC/USD daily chart currently depict that a relative price reversion is ongoing in the market. A Japanese candlestick strives to shape at the level of $35,000 where both the smaller SMA and the bearish trend-line conjoined. The 50-day SMA indicator is above the 14-day SMA trend-line as the critical support baseline remains intact at the level of $30,000. The Stochastic Oscillators have with one line faintly touched past range 80 into the overbought region. That signifies that the forces to the upside are less active. And, as a result, a slight reverse may feature in the crypto’s trading stance in no time.
What could be the price action as the price holds tight around the level of $35,000?
The tight holding of the BTC/USD market at the level of $35,000 poses a potential of having a return outcome of a bearish trend once more. The reason is that the market’s capacity to push northward further is on a gradual fading process as the current market’s slow-motion could lead to a consolidation that may eventually give way to a hike at that zone. In the long run, bulls may nurse the mind of getting more market’s valuation increase
The market point at $35,000 believes to be the zone that selling pressures should hold their presence stronger against any sudden upsurge in the valuation of the BTC/USD market operations. Traders having the market bias of shorting their positions around that point should be wary of a sudden formation of bullish candlestick also short serial northward pushes. Yet, some buying points of entry are visible while a downward push features below the earlier point mentioned.
BTC/USD 4-hour Chart
The initial notable rebounding movement made by the BTC/USD market on the medium-term run has gradually reverted while price hit resistance around the level of $36,000. The 50-day SMA indicator is over the 14-day SMA trend-line with a tiny space between them. The Stochastic Oscillators have swerved the lines southbound toward range 20. That signifies that depression is currently happening in the market transaction involving Bitcoin and the United States of America’s currency.
Note: new.cryptosignals.org is not a financial advisor. Do your research before investing your funds in any financial asset or presented product or event. We are not responsible for your investing results.
You can purchase crypto coins here. Buy Tokens


