Bitcoin (BTC/USD) Keeps a Bearish Path
Estimated Reading Time: 3 minutes
Don’t invest unless you’re prepared to lose all the money you invest. This is a high-risk investment and you are unlikely to be protected if something goes wrong. Take 2 minutes to learn more
Bitcoin Price Prediction – May 23
There is a slight sign of continuity in the bearish path that the BTC/USD market has experienced over time until the present. BTC now trades against the US Dollar at around the line of $38,128 at a rate of about 1.34% increase.
BTC/USD Market
Key Levels:
Resistance levels: $45,000, $50,000, $55,000,
Support levels: $35,000, $30,000, $25,000
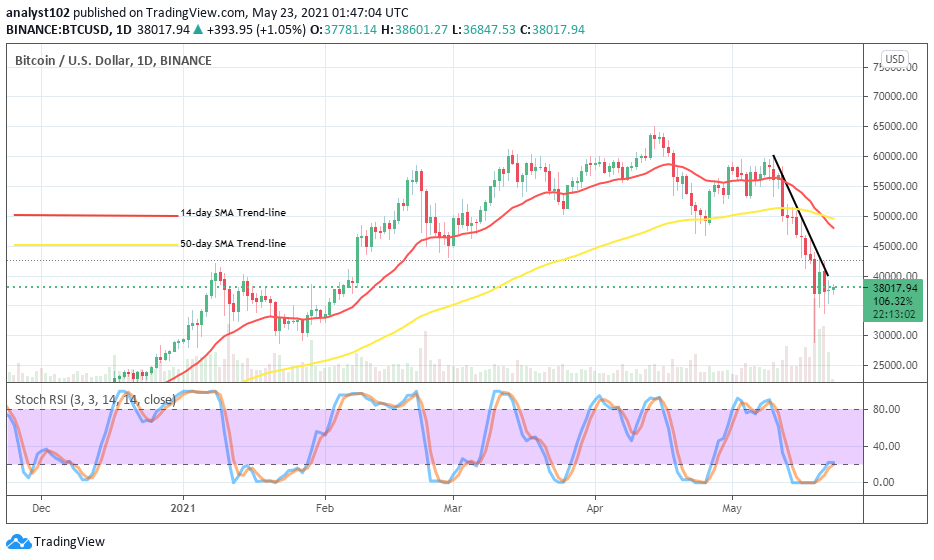
BTC/USD – Daily Chart
It has now depicted on the BTC/USD daily chart that the 50-day SMA indicator has been freshly intercepted from the top by the 14-day SMA trend-line to affirm that the market has turned total bearish trend-outlook. About a couple of days’ sessions back, the crypto-economic value has in its re-bouncing efforts from a lower point of around $30,000 been finding it difficult to swing past the level of $40,000. The bearish trend-line has drawn to place at the point below the smaller SMA. The Stochastic Oscillators have initially briefly moved from the oversold region to now attempting closing of the hairs at range 20. That signifies the possibility that the crypto-market
The BTC/USD price dipping, will it be kept furthermore?
As it has been technically observed that the main difficult trading zone against the current rebound moving efforts being so far by the BTC/USD bulls in the market has is the level of $40,000. Making that in an affirmative confirmation, hence is the interception of the bigger SMA by the smaller SMA from the top to the downside. As a result, the most probable decent entries for buy will have to take forms after variant downward price reverses are ongoing below a lower value of the point earlier mentioned.
The downward side analysis of this crypto market has to keep featuring around the $40,000 market level or a bit upward nearing the higher value of $45,000. However, a violent sudden breakout of those points will mostly push bears out of a sustainable potential further free fall-offs of the crypto market space. Therefore, there is a need to exercise some degrees of cautiousness while an order for trade. Meanwhile, this point in time seems to be a good investment period.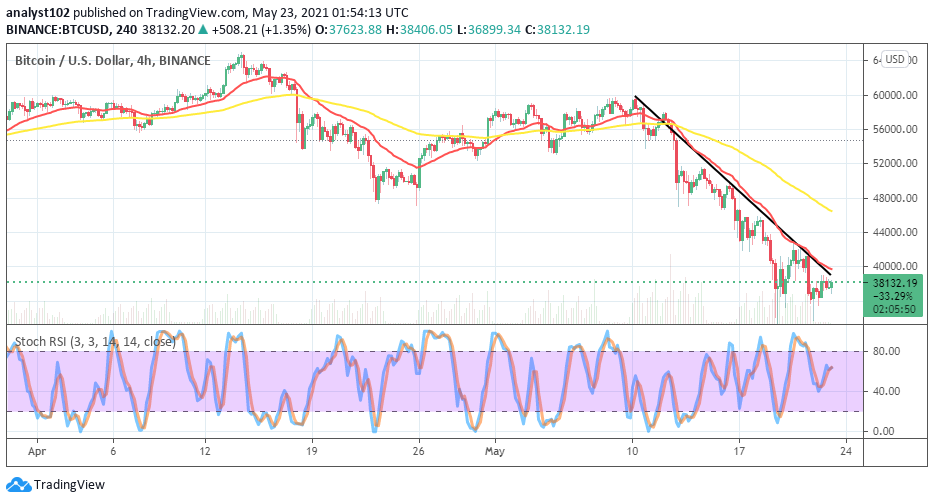
BTC/USD 4-hour Chart
The BTC/USD market moves have been falling underneath the bearish trend-line and the smaller SMA indicator as it is depicted on the 4-hour chart. The 50-day SMA trend-line is located around $46,000 level over the 14-day SMA trading indicator. The Stochastic Oscillators are in between the ranges of 80 and 40 with closed hairs seemingly attempting to cross to the south to indicate more coming of possible downs in the near session. Nevertheless, bears need to be watchful of escaping from being caged by a fake resumption of downward forces at some of the levels around the support area of $35,000.
Note: Cryptosignals.org is not a financial advisor. Do your research before investing your funds in any financial asset or presented product or event. We are not responsible for your investing results.