Bitcoin (BTC/USD) Market Attempts Deepening Corrections
Estimated Reading Time: 3 minutes
Don’t invest unless you’re prepared to lose all the money you invest. This is a high-risk investment and you are unlikely to be protected if something goes wrong. Take 2 minutes to learn more
Bitcoin Price Prediction – December 15
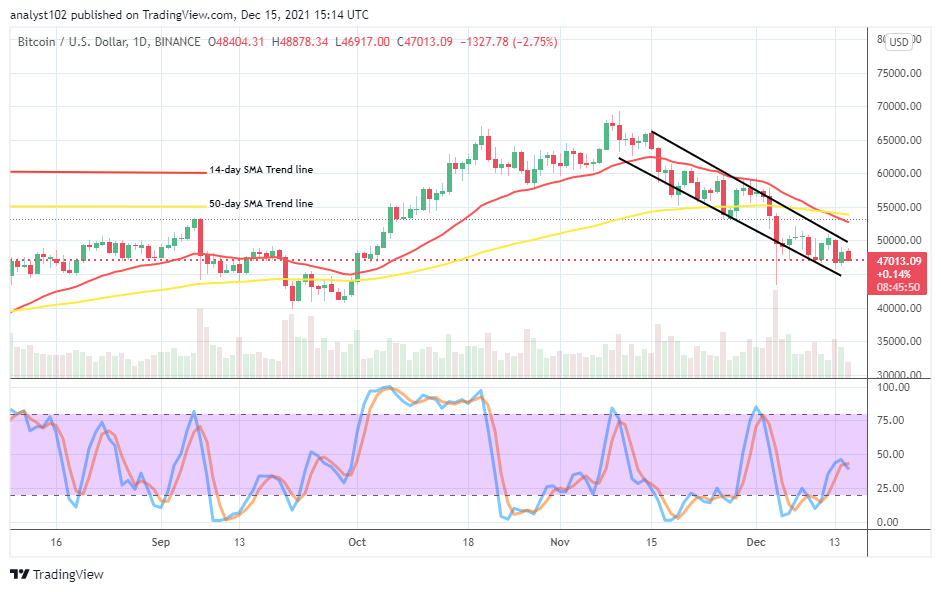
There is a closure thought that the BTC/USD market attempts deepening corrections in the bearish channels after getting a higher valuation of $48,878. The crypto-economic price currently trades around $47,013 at an average percentage rate of about 2.75 negatives.
BTC/USD Market
Key Levels:
Resistance levels: $50,000, $52,500, $55,000
Support levels: $45,000, $42,500, $40,000
BTC/USD – Daily Chart
The BTC/USD daily chart reveals that the crypto market attempts deepening corrections within the trading space of the bearish channel trend lines drawn below the SMA trend lines. To that effect, a bearish candlestick is in the making to signify a depression motion as of writing. The 50-day SMA indicator has been crossed southward by the 14-day SMA indicator. The Stochastic Oscillators have briefly crossed the lines southbound near beneath the range of 50. That signals that a downward motion attempts, showing up again in the crypto-economic trading activities.
Does the BTC/USD current trading situation back the bias of getting a sustainable rebound soon as the crypto market attempts deepening corrections?
Presently, it seems not safe to launch a buy order as the BTC/USD market attempts deepening corrections within the bearish channel trend lines toward a lower support zone at $45,000. It would technically sound okay that long-position takers of this market stay alert to observe an active re-occurring of a rally motion tends to materialize from the current deepening corrections before considering exerting a buy position afterward.
On the downside of the technical analysis, the resistance area under t$50,000 would have to be a stronghold by short-position takers as an ideal zone to spot a return of depression in the market as long as the price remains losing momentum when trying to approach the value line. A sudden fearful breakdown against $45,000 may elongate the drawing of the bearish channel trend lines.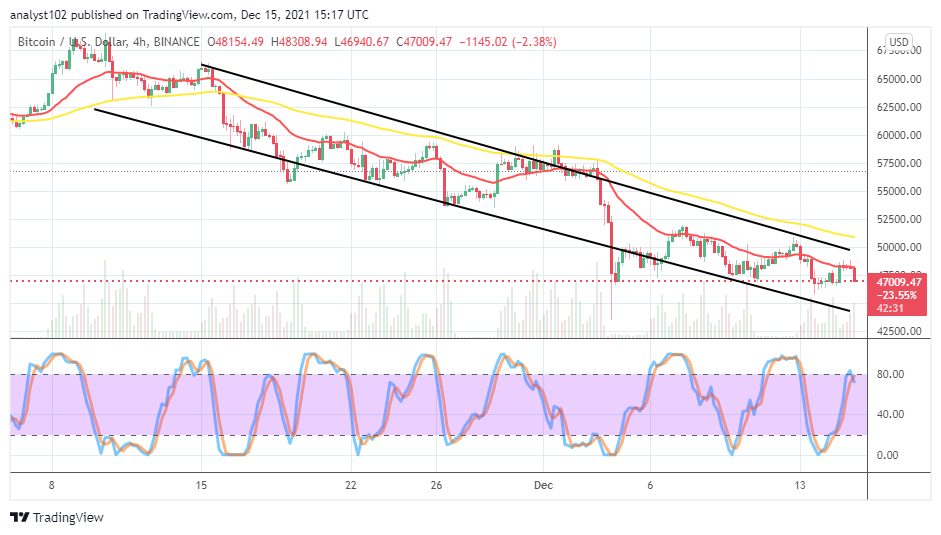
BTC/USD 4-hour Charts
The BTC/USD medium-term chart showcases that the crypto-economic market attempts deepening corrections from the smaller SMA trend line. The 50-day SMA indicator is above the 14-day SMA indicator. The positioning of the Stochastic Oscillators at the range of 80 with the lines briefly crossed southbound portends a serious-warning signal against seeing the base trading instrument making a push to checkmate the US Dollar in the near time. Therefore, longing orders may have to suspend for a while.
Note: Cryptosignals.org is not a financial advisor. Do your research before investing your funds in any financial asset or presented product or event. We are not responsible for your investing results.
You can purchase crypto coins here. Buy Tokens