Bitcoin (BTC/USD) Market Dumps Higher Beyond $20,000
Estimated Reading Time: 3 minutes
Don’t invest unless you’re prepared to lose all the money you invest. This is a high-risk investment and you are unlikely to be protected if something goes wrong. Take 2 minutes to learn more

Free Crypto Signals Channel
Bitcoin Price Prediction – June 19
It has been on the record of the BTC/USD that its price dumps higher beyond the $20,000 psychological lower-trading spot to affirm a continuation in the ongoing downward-trending cycle. Over the last several hours, price has featured between $20,000 and $18,000 value lines at a 3.51% positive.
BTC/USD Market
Key Levels
Resistance levels: $22,500, $25,000, $27,500
Support levels: $17,500, $15,000, $12,500
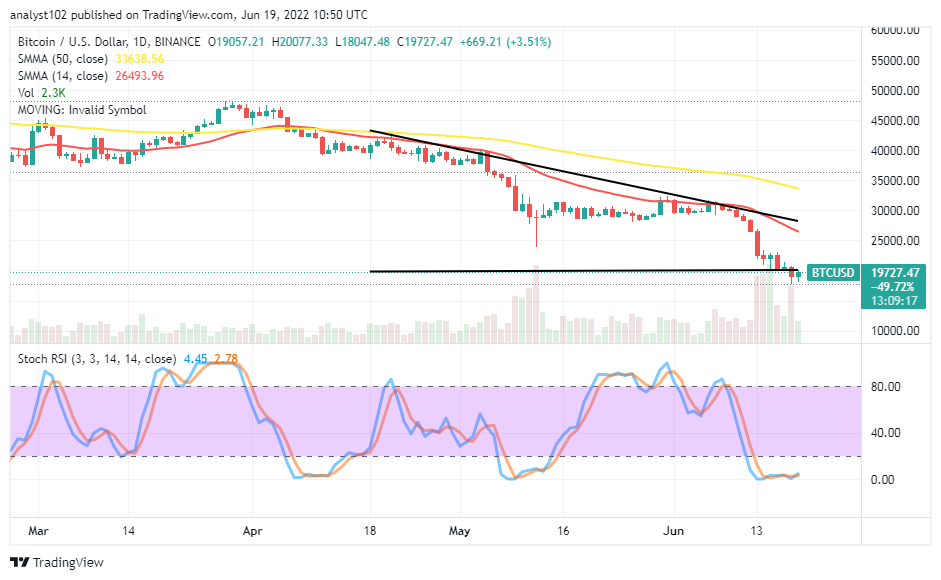
BTC/USD – Daily Chart
The BTC/USD daily chart reveals the crypto market dumps higher beyond the $20,000 psychological level that was formerly holding against deadlier falling forces. The line has breached southward as a result of bears’ intense depressive strength to get a reset of support levels from a lower point at $17,500 downwards. The 14-day SMA indicator is below the 50-day SMA indicator. The bearish trend line is around the smaller SMA far above the current trading zone. The Stochastic Oscillators are in the oversold region with their lines conjoined, signifying price is consolidating at a lower-trading spot.
Will the BTC/USD market reverse to break through variant supports down to the $15,000 afterward?
As the BTC/USD market dumps higher beyond the $20,000 in the recent past shows the price may not survive recovery in the near time above it. A smaller-bullish candlestick is in the making, indicating a necessary rallying motion is on a lighter-moving mode toward the logical value-line mentioned earlier. Bulls needed a push from its current lower-trading point against the point. And it should be devoid of giving in back to any correctional move to allow buying positions to forge ahead in their recovery motions.
On the downside of the technical analysis, the BTC/USD market may allow the price to heave a sigh of relief from the downward-trending movement for a while. In the wake of that assumption tending to play out, points between $22,500 and $25,000 can be tough against upward swings in the long-term rum. It may not be technically good to go for a re=launch of new selling position orders around the $20,000 level without taking to a principle guiding proper money management.
BTC/USD 4-hour Chart
The BTC/USD medium-term chart reveals the crypto market dumps higher beyond the $20,000 logical trading zone that initially served as the baseline expected to give the trade back some upswings against bears’ forces. The 14-day SMA trend line is underneath the 50-day SMA trend line. The Stochastic Oscillators have sprung northbound from the oversold region toward the range at 80 from the beneath. As of writing, a bullish candlestick is somewhat intensely beefing up toward the value line to indicate buyers are struggling to regain a part of their lost momentums. A long-holding of the market around the smaller SMA will give the sellers the advantage to leverage any selling signal that can emanate at any given point.
Note: Cryptosignals.org is not a financial advisor. Do your research before investing your funds in any financial asset or presented product or event. We are not responsible for your investing results.
“Lucky is up more than 50% today but still more than 430% from All Time Highs!
The opportunity to bank BIG is now!
You can purchase Lucky Block here. Buy LBlock