Bitcoin (BTC/USD) Market Elongates Moves in Range
Estimated Reading Time: 3 minutes
Don’t invest unless you’re prepared to lose all the money you invest. This is a high-risk investment and you are unlikely to be protected if something goes wrong. Take 2 minutes to learn more

Free Crypto Signals Channel
Bitcoin Price Prediction – July 6
The BTC/USD market elongates moves in the range of around $20,000. Over the last several hours, the price has been trading at $20,354 and $19,735 at a minimal rate of- 0.90%.
BTC/USD Market
Key Levels:
Resistance levels: $22,500, $25,000, $27,500
Support levels: $17,500, $15,000, $12,500
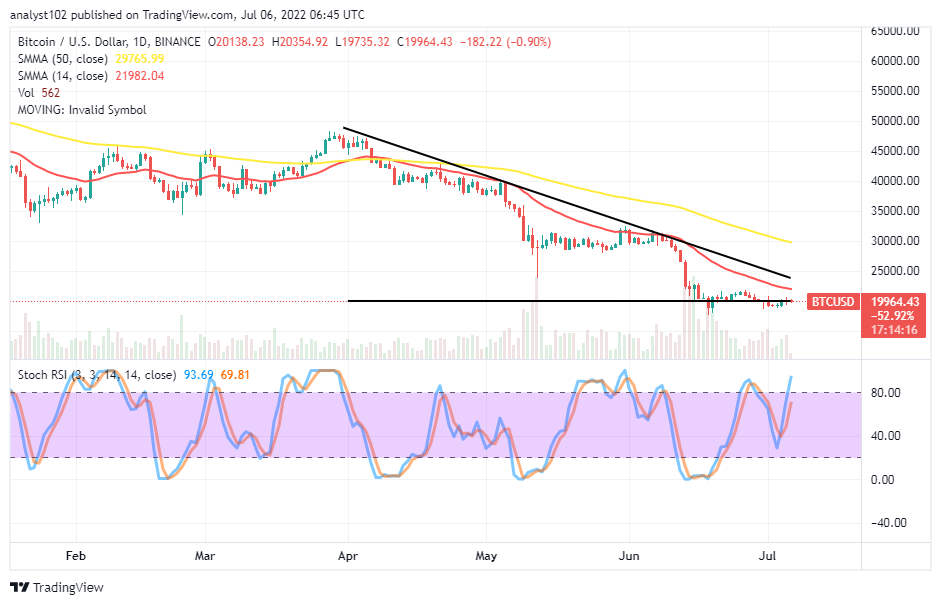
BTC/USD – Daily Chart
The BTC/USD daily chart reveals the crypto-economic market elongates, ranging moves around the $20,000 psychological level underneath the trend lines of the SMAs. The 14-day SMA indicator is beneath the 50-day SMA indicator. The Stochastic Oscillators have swerved northbound from around the range of 40 slightly into the overbought region. There is a light bearish candlestick in the making to signify the situation is relatively experiencing depression.
Can there still be a prolongation in the BTC/USD market activities until the following sessions?
There can still be a prolongation of the BTC/USD trade by around $20,000 over some sessions to feature more. The crypto market elongates moves in a range around the horizontal line to showcase the market hasn’t been able to maintain a definite direction. The technical trading view suggests the market needs downward movements toward the $17,500 support levels to rebuild energy at various capacities.
On the downside of the technical analysis, fetching a resistant-trading clue from the trend line of the 14-day SMA, bears tend to push against any aftermath upswing bound to occur in the market. There can be selling signals while the price tries to swing upward for a touch of resistance point before the $21,982 resistance value-line indicated by the SMA indicator. All in all, traders should be wary of exerting new orders in the current face of the trading situation.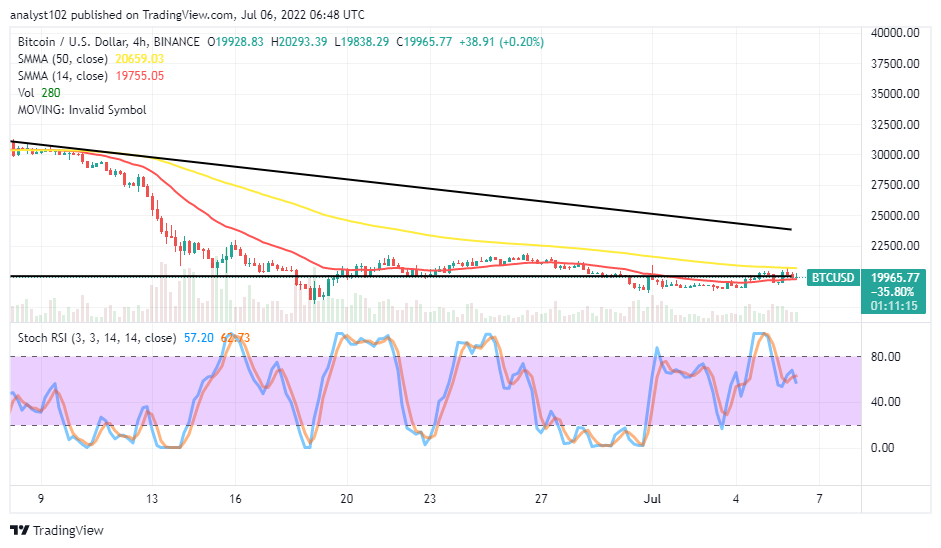
BTC/USD 4-hour Chart
The BTC/USD medium-term chart showcases the crypto economy elongates moves in range, involving the smaller SMA, which is swinging to the east around the horizontal line drawn at the $20,000 level. The 14-day SMA indicator is underneath the 50-day SMA indicator. The bearish trend line drew southward between the resistances of $22,500 and $25,000 values. The Stochastic Oscillators have crossed southbound from the overbought region. That raises a suggestion that a falling force is somewhat imminent.
Note: Cryptosignals.org is not a financial advisor. Do your research before investing your funds in any financial asset or presented product or event. We are not responsible for your investing results.
“Lucky is up more than 50% today but still more than 430% from All Time Highs!
The opportunity to bank BIG is now!
You can purchase Lucky Block here. Buy LBlock