Bitcoin (BTC/USD) Market Fluctuates Southward Near $22,500
Estimated Reading Time: 3 minutes
Don’t invest unless you’re prepared to lose all the money you invest. This is a high-risk investment and you are unlikely to be protected if something goes wrong. Take 2 minutes to learn more
Bitcoin Price Prediction – February 1
In the last several days, there has been a line of uprisings in the BTC/USD trade operations as the crypto-economic market fluctuates southward near the lower-trading zone of $22,500. Trading activities since the beginning of today’s session have remained between the $23,193.42 and $22,922.13 value lines. It observed that the price maintains a minute negative percentage rate of 0.65 as of the writing of this technical analytics piece.
BTC/USD Market
Key Levels:
Resistance levels: $24,500, $25,500, $26,500
Support levels: $21,000, $20,000, $19,000
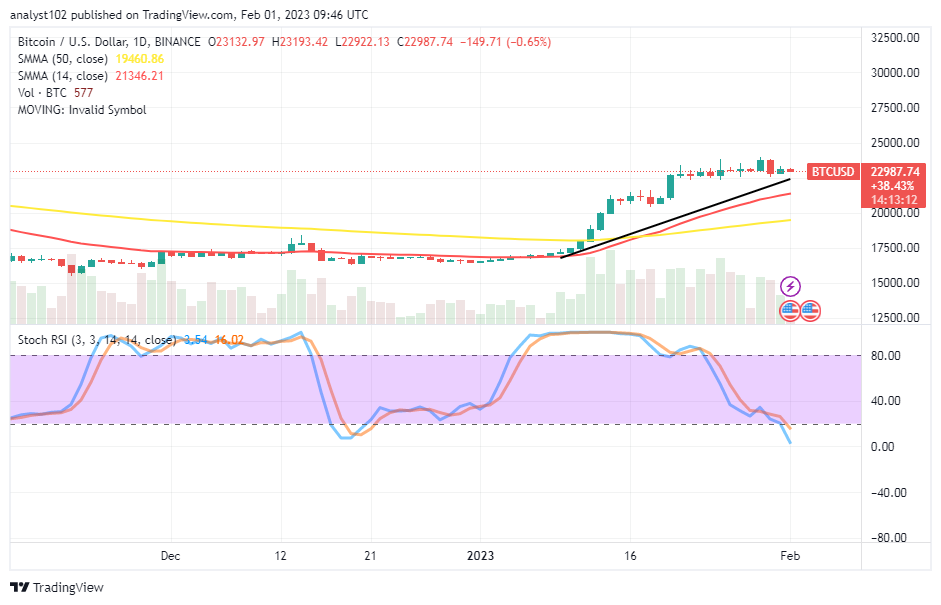
BTC/USD – Daily Chart
Today’s reading on the BTC/USD daily chart reveals that the crypto-economic market fluctuates southward near the $22,500 level. If a long bearish trading candlestick appears against areas of support at $21,000, it will be that more lows will occur below the main resistance level of around $24,500. The 14-day SMA indicator is above the 50-day SMA indicator, pointing toward the north beneath the current trading zone. The Stochastic Oscillators are in a southbound-crossing mode, keeping 16.02 and 3.54 levels.
Will the Bitcoin/USD market soon re-establish itself around the $22,500 level?
If the current pace of slight declining motion in the BTC/USD trade gets exhausted in the near time around the $22,500 level, a rallying cycle will take place even though the market fluctuates southward near the point in question. As it is, there is a weight of depression capable of nudging the price worth to around the 14-day SMA indicator in the long run to find support. Buyers need the emergence of a bullish candlestick to affirm a brighter sign to launch their positions afterward.
On the southward-moving side of the BTC/USD trade technical, the presence of bears around $22,500 has to consolidate forces against the value line in the long run. In the meantime, the reading of the Stochastic Oscillators portends that the catalyst’s ability to push to the downside is in a decrease-moving manner. But, they still point relatively to the south direction.
BTC/USD 4-hour Chart
The BTC/USD medium-term chart mirrors that the crypto market fluctuates southward near $22,500. On the 20th of January, a bullish spanned northward into $23,000 and $24,000 points, resulting in a chain of smaller 4-hour candlesticks indicating a sideways trend. The 14-day SMA indicator is at $23,105.01 over the $22,170.90 value line of the 50-day SMA indicator. The Stochastic Oscillators are at 31.34 and 30.24 levels, attempting to cross southbound. The situation may produce some lows at a lighter note toward the point of the bigger SMA before gaining back an upswing.
Note: Cryptosignals.org is not a financial advisor. Do your research before investing your funds in any financial asset or presented product or event. We are not responsible for your investing results.
You can purchase Lucky Block here. Buy LBLOCK