Bitcoin (BTC/USD) Market Hits a $45,000 Resistance
Estimated Reading Time: 3 minutes
Don’t invest unless you’re prepared to lose all the money you invest. This is a high-risk investment and you are unlikely to be protected if something goes wrong. Take 2 minutes to learn more

Free Crypto Signals Channel
Bitcoin Price Prediction – March 27
The BTC/USD market hits a $45,000 resistance spot in a slow-and-steady moving style. The movement connotes that a rallying motion is in progressive order as the crypto economy trades between the high of $45,004 and a low of $44,509 at a minute average percentage of 0.34.
BTC/USD Market
Key Levels
Resistance levels: $45,000, $47,500, $50,000
Support levels: $42,500, $40,000, $37,500
BTC/USD – Daily Chart
The BTC/USD daily chart showcases the crypto-economic market hits a $45,000 resistance as the crypto-economic price surge higher in a slow-active motion. Despite the current picture of the trading situation, the bearish pattern is yet to fade out of the genuine trading trait of the crypto economy. The 14-day SMA has slightly bent northward closely, beneath the 50-day SMA The Stochastic Oscillators are in the overbought region, trying to join the lines together. That suggests the market may soon be experiencing a pit stop.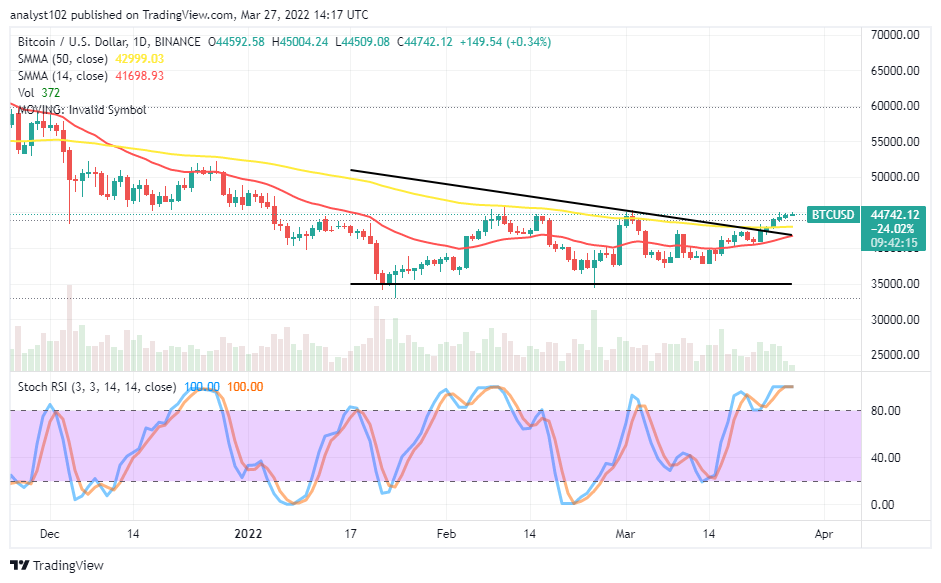
Will the BTC/USD trade continue to consolidate toward getting a higher point as the crypto market hits the $45,000 resistance level?
The BTC/USD trade operations portend that price will still hold above the SMA trend lines for a while as the crypto-economic market hits the $45,000 resistance level. Bulls are somewhat still prevailing over the US Dollar’s weak purchasing force as the crypto trades continue to push northwardly. But, it is not easy as well to get decent entry. And that has made the sustainability of new long positions opened about a couple of days dicey. A bearish candlestick may suddenly emerge to decimate some of the ups in no time.
On the downside of the technical analysis, the BTC/USD market short-position takers seem to be cautious before pushing back the crypto-economic price downward. Therefore, traders to exercise more patience toward getting decent entries for a selling order afterward. Minimally, about two to three bearish candlesticks needed to appear as a confirmation sign at around $45,000 before considering entering a selling order.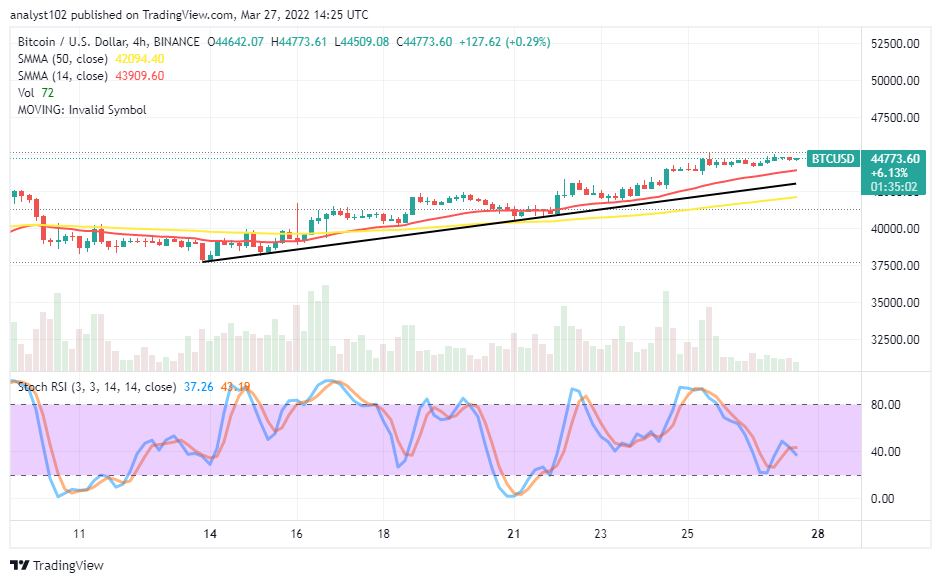
BTC/USD 4-hour Chart
The BTC/USD medium-term chart shows the crypto-economic market hits a $45,000 resistance trading level. There is a feeling of a bullish trading outlook in the medium-term run of the market. The 14-day SMA indicator is above the 50-day SMA indicator. The bullish trend line drew between the SMAs. The Stochastic Oscillators have moved down from the overbought region to find a place between the ranges at 40 and 20. They are seemingly again trying to cross the lines southbound at the range of 40. It means the crypto economy may lose stance fat its current trading capacity against the US economy.
Note: Cryptosignals.org is not a financial advisor. Do your research before investing your funds in any financial asset or presented product or event. We are not responsible for your investing results.
You can purchase Lucky Block here. Buy LBlock: