Bitcoin (BTC/USD) Market Holds In the Psychological Zones
Estimated Reading Time: 3 minutes
Don’t invest unless you’re prepared to lose all the money you invest. This is a high-risk investment and you are unlikely to be protected if something goes wrong. Take 2 minutes to learn more
Bitcoin Price Prediction – November 21
As of the writing of this crypto-economic article, the BTC/USD market holds in the psychological zones of $60,000 and $55,000. The impact of the volatile corrections is still relatively on by the market. Price witnesses a reduction, trading around $58,951 at a percentage rate of about 2.37 negative.
BTC/USD Market
Key Levels:
Resistance levels: $62,500, $65,000, $67,500
Support levels: $55,000, $52,500,$50,000
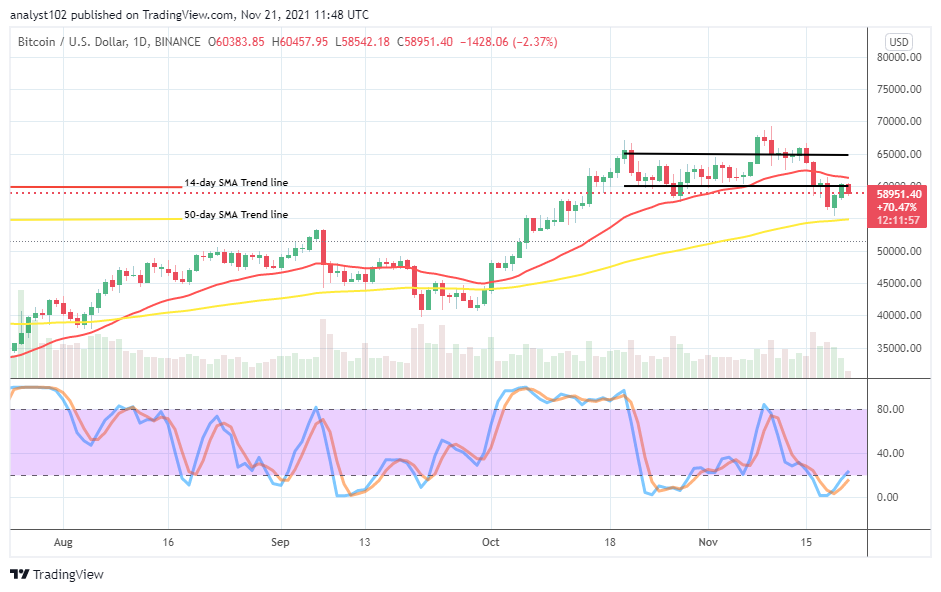
BTC/USD – Daily Chart
The BTC/USD daily chart reveals that the crypto market holds in the psychological zones of $60,000 and $55,000 values. The higher value line happens to be the lower range zone, while the upper range line drew at $65,000. The 14-day SMA trend line is in the range-bound zones close to the lower axis above the 50-day SMA trend line, which is at the second value line mentioned earlier. The Stochastic Oscillators have briefly crossed the lines from the overbought region against the range of 20. A bearish candlestick currently seems to be in the making, downing southward from the lower range spot. That suggests that a depression motion is still necessary to re-surface for a while.
What could be the better trading approach as the BTC/USD market holds in the psychological zones of $60,000 and $55,000?
The better approach toward trading in the current situation of the BTC/USD business operation as the market holds in the psychological zones of $60,000 and $55,000 is that buyers needed to await some weighty rebounding forces when the price might have witnessed some pull-downs. The present market conditions have appeared to build up the muscles from the lowest value-line mentioned earlier. In other words, the point may serve as the critical support baseline of the subsequent upswings of the crypto economy.
On the downside, the market now appears succumbing to pressure, stemming from a barrier of around $60,000 that constitutes a resistance index of the current ongoing slight depression. A sudden fearful breakout at that point will involve the 14-day SMA indicator to invalidate the possibility of getting a decent sell order at that trading capacity. However, as regards the current trading situation underneath the line, the crypto’s price may push a bit lowering to average the 50-day SMA trend line around $55,000 in the long run.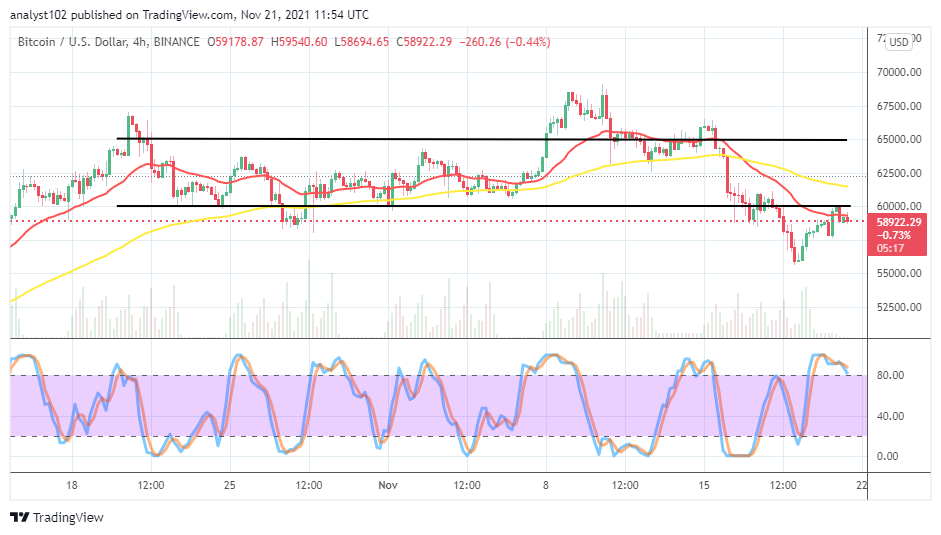
BTC/USD 4-hour Chart
The BTC/USD 4-hour chart showcases that the crypto market holds in the psychological zones. In about a few hours of trading back, the crypto-economic price managed to touch the lower range line, playing a higher level to the lower psychological zone at $55,000. The 14-day SMA indicator is underneath the 50-day SMA indicator. The Stochastic Oscillators have joined the lines, slightly pointing southbound closer to the range of 80. That suggests that some amounts of depressions are relatively ongoing. Therefore, long position takers are to look out for when there will be a rallying movement to re-launch an order.
Note: Cryptosignals.org is not a financial advisor. Do your research before investing your funds in any financial asset or presented product or event. We are not responsible for your investing results.
You can purchase crypto coins here. Buy Tokens