Bitcoin (BTC/USD) Market Keeps a Deep Below $17,500
Estimated Reading Time: 3 minutes
Don’t invest unless you’re prepared to lose all the money you invest. This is a high-risk investment and you are unlikely to be protected if something goes wrong. Take 2 minutes to learn more
Bitcoin Price Prediction – November 16
The impact of the last effective declining motion has led the BTC/USD market to keep a deep below the $17,500 psychological lower point. The negativity in the crypto economy has given birth to a -1.77 percent rate as the price trades at $16.586.92.
BTC/USD Market
Key Levels:
Resistance levels: $18,500, $20,500, $22,500
Support levels: $15,000, $12,500, $10,000
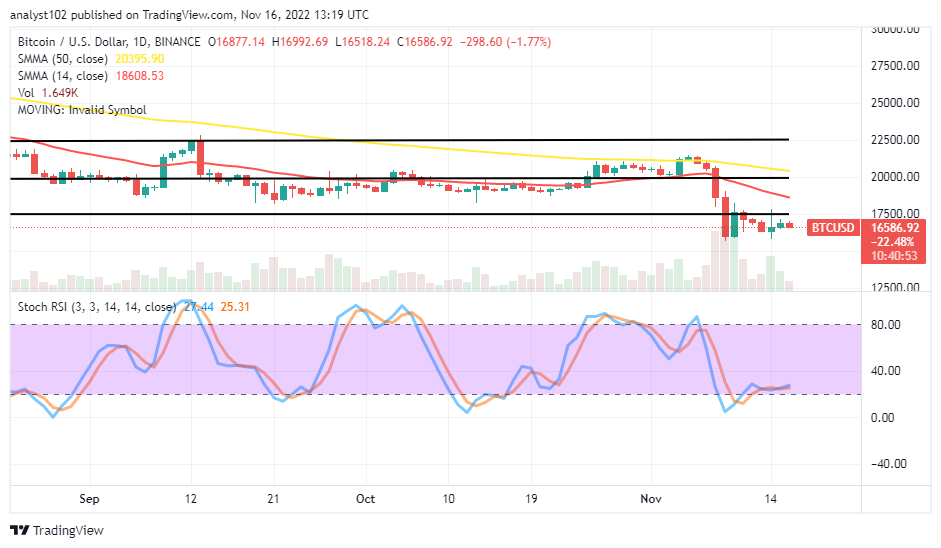
BTC/USD – Daily Chart
The BTC/USD daily chart showcases the crypto market keeps a deep below $17,500 at close points. The horizontal line drawn around the trading value line depicts the newer technical level at a lower-trading spot against the higher point of $20,000 line. The 14-day SMA indicator is at $18608.53, beneath the $20,395.90 value line of the 50-day SMA indicator. The Stochastic Oscillators have conjoined their lines tightly over the range of 20. And they are now trying to swerve northbound with a less-active move at 25.31 and 27.44 levels.
Will the BTC/USD market consolidation move mode below $17,500 lead to more downs?
The BTC/USD trade’s consolidation below the $17,500 level will almost certainly result in new lows as the crypto market remains well below the value line. A bullish candlestick needs to resurface from above the $15,000 support level to span northward against the trend line of the 14-day SMA to confirm the validity of an upward resumption mode. A timely sudden reversal move against or around the lowest spot will propel bears’ forces to go beyond the support point afterward.
The downside of the BTC/USD technical analysis suggests that bears will resume a declining force around the resistance trading spot at the 14-day SMA trend line. If the market fails to succumb to sellers’ reactions around the SMA indicator, it will rebuild a convergence that can lead to a situation causing the weakness of bulls’ strength.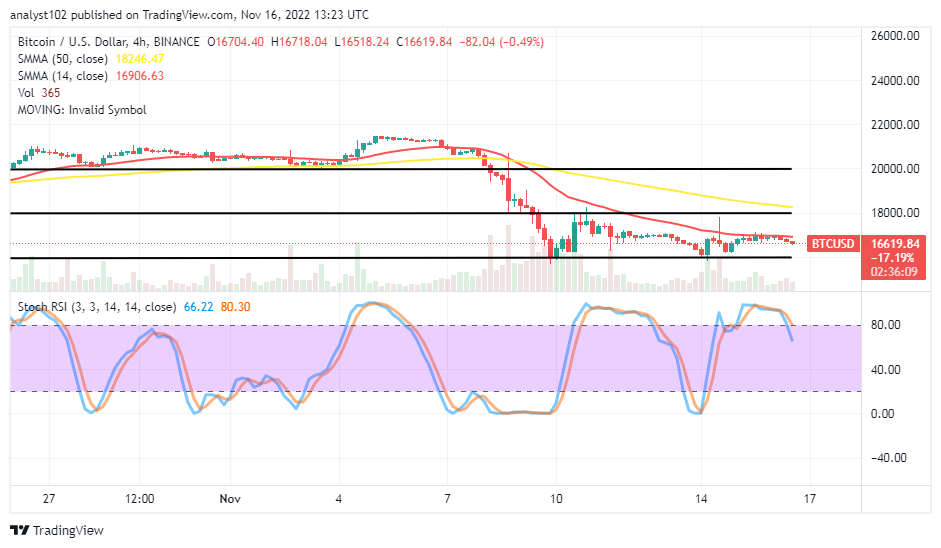
BTC/USD 4-hour Chart
The BTC/USD medium-term chart reveals the crypto market keeps deep between the points of $18,000 and $16,000. The upper and the lower horizontal lines have been to mark those points for certainty. The 14-day SMA indicator is at $16,906.63, beneath the $18,246.47 value line of the 50-day SMA indicator. The Stochastic Oscillators have crossed southbound to 80.30 and 66.22 levels. That signifies the forces to the downside are on a gradual systemic reduction process.
Note: Cryptosignals.org is not a financial advisor. Do your research before investing your funds in any financial asset or presented product or event. We are not responsible for your investing results.
You can purchase Lucky Block here. Buy LBLOCK