Bitcoin (BTC/USD) Market Keeps Downward Correction
Estimated Reading Time: 3 minutes
Don’t invest unless you’re prepared to lose all the money you invest. This is a high-risk investment and you are unlikely to be protected if something goes wrong. Take 2 minutes to learn more
Bitcoin Price Prediction – September 26
The BTC/USD market keeps downward correction as price has dared, touching the level of $40,000 in the process of intensifying. The crypto’s price is trading around the $43,473 value line at a positive percentage rate of about 1.18. It seems there is a promissory upside motion in the market.
BTC/USD Market
Key Levels:
Resistance levels: $45,000, $47,500, $50,000
Support levels: $40,000, $42,500, $40,000
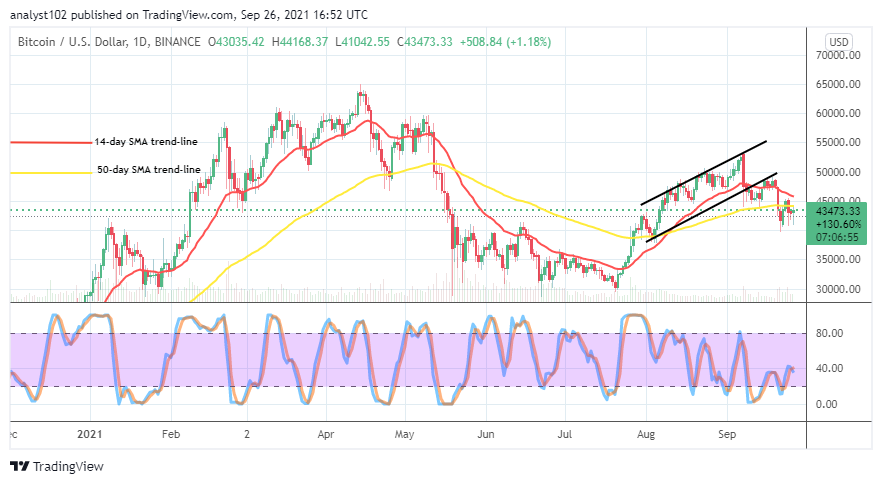
BTC/USD – Daily Chart
The BTC/USD daily chart showcases that the market keeps a downward correction around the trend line of the 50-day SMA. Variant candlesticks indicating ups and downs have been featuring around the SMA from September 21 until the present. The 14-day SMA indicator is above the 50-day SMA indicator. The Stochastic Oscillators are seemingly consolidating around the oversold region and the range of 40. That shows that some notable rises and decreases are being systemically featuring in the crypto economy.
Could the current trading situation degenerate into a full-fledged bearish trend as the market keeps a downward correction?
Degenerating the current trading situation of the BTC/USD trade may not hold valuation lower for long beneath the level of $40,000 as the market keeps downward correction. The current trading situation appears to keep around the two major points at $45,000 and $40,000 levels. A breakout at the higher value-line may signify that bulls have had a better chance to re-launch fully back into the upside trend.
On the downside, the BTC/USD market bears would have to hold their positions tight around $45,000 level against any upsurge. A long-southward curve of the 14-day SMA above the 50-day SMA will portend the possibility that a downward force will dominate the market. The market line at $40,000 remains the immediate critical support price may push down. Therefore, it may be risky that selling positions are left long open.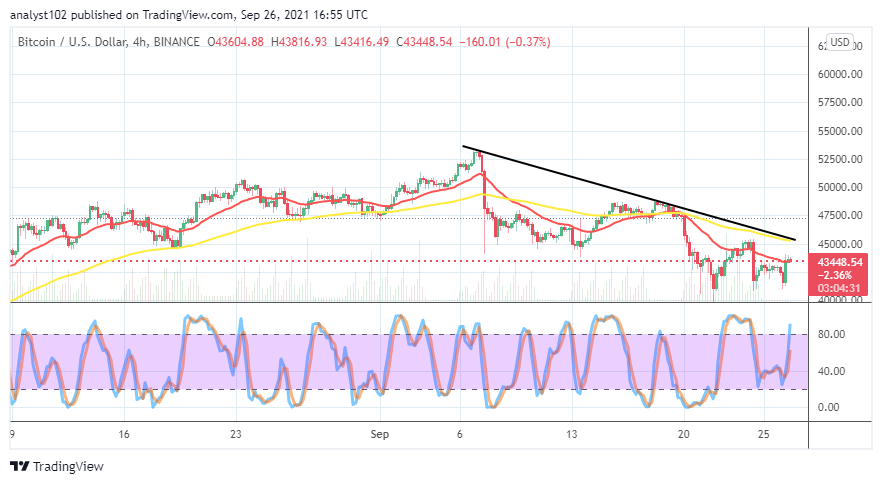
BTC/USD 4-hour Chart
The BCT/USD 4-hour chart reveals that the crypto market keeps a downward force. The trend outlook is more bearish in the medium-term run. The 14-day SMA indicator is underneath the 50-day SMA indicator as the bearish trend line drew over them. The Stochastic Oscillators have swerved the lines northbound with the blue penetrating the overbought region. A bullish candlestick has formed against $42,500, slightly pushing upward around the trend line of the smaller SMA. It shows that bulls have been gaining supports between the value line and the $40,000 level.
Note: Cryptosignals.org is not a financial advisor. Do your research before investing your funds in any financial asset or presented product or event. We are not responsible for your investing results.
You can purchase crypto coins here. Buy Tokens