Bitcoin (BTC/USD) Market Loses Momentums at $50,000
Estimated Reading Time: 3 minutes
Don’t invest unless you’re prepared to lose all the money you invest. This is a high-risk investment and you are unlikely to be protected if something goes wrong. Take 2 minutes to learn more
Bitcoin Price Prediction – December 29
The BTC/USD market loses momentums at the $50,000 level, leading the crypto-economic price trade around a lower trading line of about $4,683. The market’s percentage rate is about 0.08 positive.
BTC/USD Market
Key Levels:
Resistance levels: $50,000, $52,500, $55,000
Support levels: $45,000, $42,500, $40,000
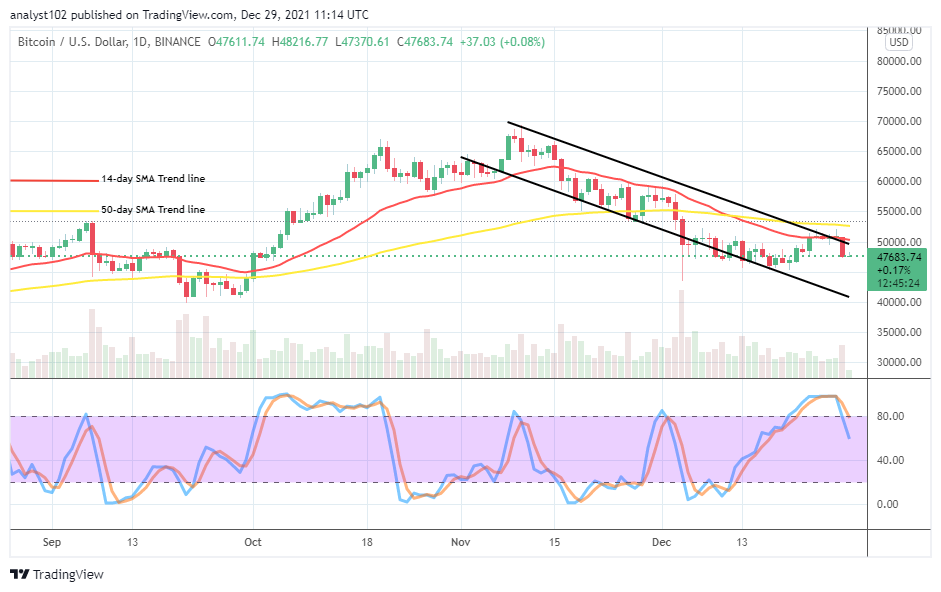
BTC/USD – Daily Chart
The BTC/USD daily chart reveals that the crypto-economic market loses momentums at $50,000. Yesterday’s session left a bearish candlestick, signaling a cell wall that price may not re-bounce back in a bid to get a quick recovery against in the near time. The 14-day SMA trend line is underneath the 50-day SMA trend line. The Stochastic Oscillators have crossed the lines southbound in the range of 80. And they still point to the south direction to signify that downward pressure is ongoing.
Will the BTC/USD trade be able to push back northward in the near time as the crypto market loses momentums at $50,000?
There has been no reliable signal to suggest near the time of the BTC/USD trade pushing northward back as the crypto market loses momentums at the $50,000 trading level. With the current pace of indication, the falling force appears to dominate the marketplace for a while. But, then, the $45,000 remains the important support baseline that price will need to break down sustainably to affirm a return of full-fledged bearish trend.
On the downside of the technical analysis, the BTC/USD market sellers may have to keep riding on the current falling force to a low trading zone, devoiding strong rebounding motion, attempting to push northward past the trend line of the 14-day SMA in the process. Some underlying levels are yet, seemingly awaiting the further falling pressures of the crypto economy between $45,000 and $40,000 if gotten heightening.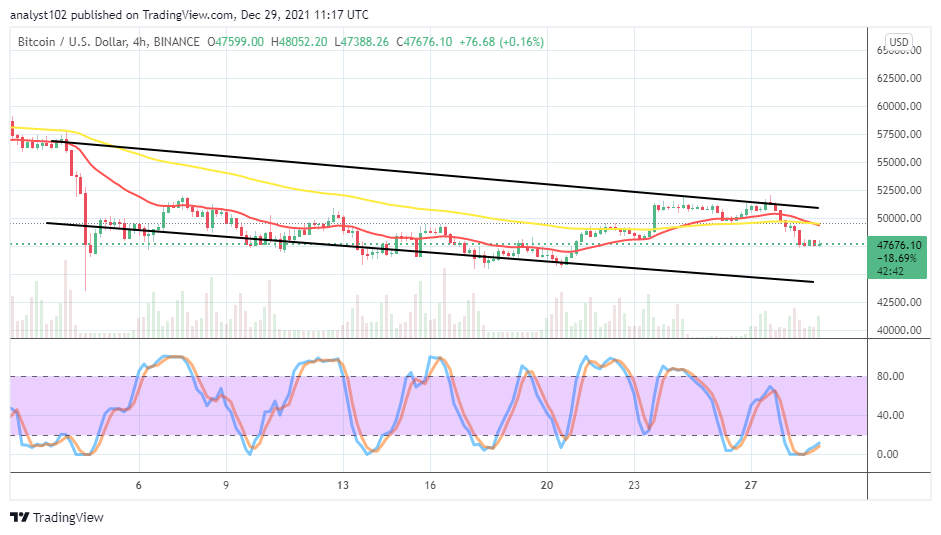
BTC/USD 4-hour Charts
The BTC/USD medium-term chart shows that the crypto-economic market loses momentums at $50,000, trading around a lower level at $47,500. The 14-day SMA trend line has crossed southward to join the 50-day SMA trend line at the top. The Stochastic Oscillators have moved southbound, dipping into the oversold region. And, they have conjoined the lines slightly northbound within it to signify that the falling forces have reached a point of near exhaustion. The market may tend to go into a ranging motion for a while around the latterly mentioned value-line if the bearish force doesn’t break down past it.
Note: Cryptosignals.org is not a financial advisor. Do your research before investing your funds in any financial asset or presented product or event. We are not responsible for your investing results.
You can purchase crypto coins here. Buy Tokens