Bitcoin (BTC/USD) Market Moves in Consolidation Below the $60,000 Key Resistance Level
Estimated Reading Time: 3 minutes
Don’t invest unless you’re prepared to lose all the money you invest. This is a high-risk investment and you are unlikely to be protected if something goes wrong. Take 2 minutes to learn more
Bitcoin Price Prediction – April 7
It has been long observed that the key resistance trading value of $60,000 has to still be in focus until the present of writing. Price yet hovers around the earlier mentioned level.
BTC/USD Market
Key Levels:
Resistance levels: $65,000, $70,000, $75,000
Support levels: $50,000, $45,000, $40,000
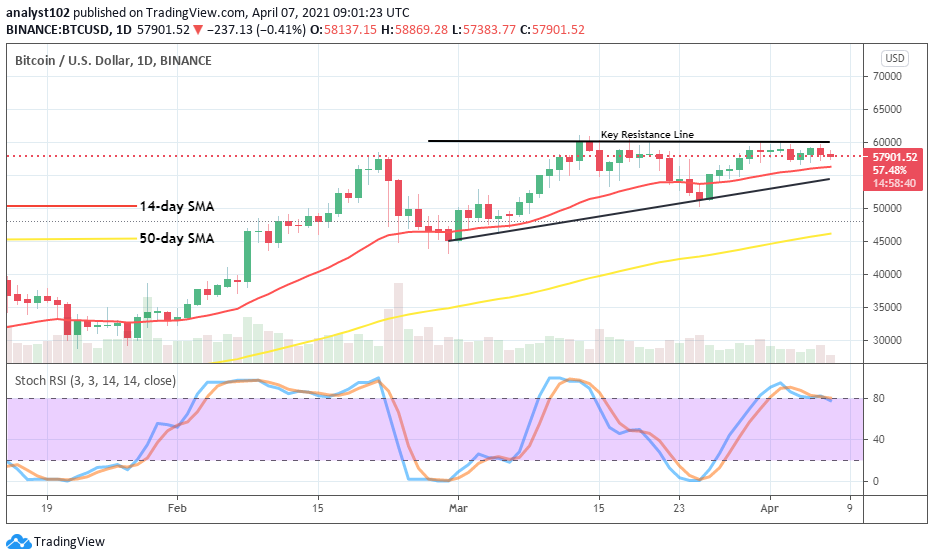
BTC/USD – Daily Chart
It is still depicted that the valuation of BTC/USD has to trade closely near the high line of $60,000. The situation has now allowed a clear drawing of a key resistance line at that point. Both the 14-day SMA and the bullish trend-lines are pointing to the north closely below the current trading zone of the crypto-economy. The 50-day SMA trend-line is situated underneath them around the support level of $45,000. The Stochastic Oscillators have conjoined in the overbought region closer to range 80. And, they now appear to begin a consolidation moving manner.
Will the BTC/USD continue moving in a consolidation around $60,000 level?
About a couple of trading days’ sessions, the market price of BTC/USD has taken to featuring basically between the levels of $60,000 and $55,000. As regards changing of trading trend, the cryptocurrency bulls have to add more efforts to breach the main resistance point of $60,000 to the north so that there can be a room to create a buying wall even if there will be a necessary short reversal afterward.
As regards the downward moving outlook of this crypto-trade, the BTC/USD bears will have to almost in the same vein breach past the $55,000 level to the south out of the current consolidation moving mode. However, a timely or instant execution of sell-order needs to be launched while it occurs. Failure to do that, the presumed trading situation can easily turn to bears whipsawed in no time.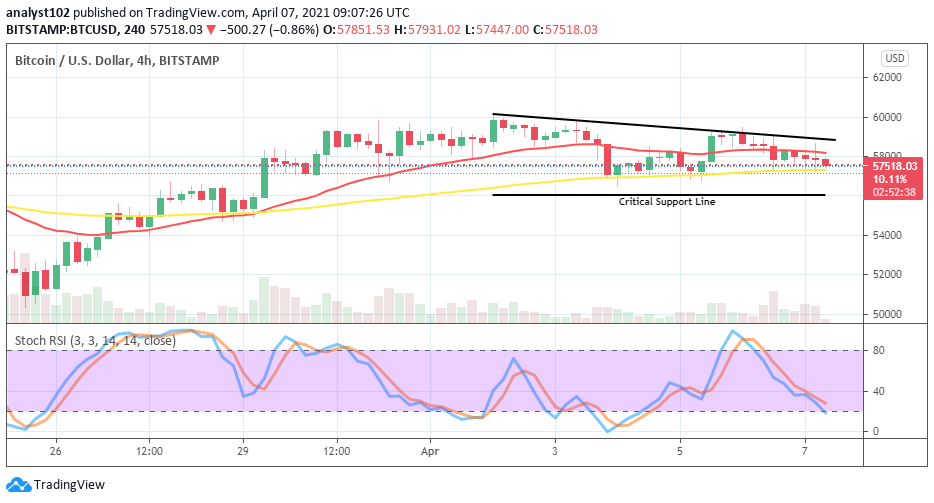
BTC/USD 4-hour Chart
It’s relatively shown on the medium-run 4hour trading chart that the BTC/USD market position now witnesses a small decline. On April 2, the crypto slight pushed northwardly against the $60,000 key resistance line. But, gradually it lost the momentum in the succeeding sessions. Price now hovers around the level of $58,000. The 14-day SMA is located over the 50-day SMA as they both point towards the east direction. The Stochastic Oscillators have slantingly crossed from the overbought region to touch range 20. Meanwhile, a critical support line is located at $56,000. And, a sudden break-down of it could result in seeing a line of further depreciation in the crypto-market.
Note: cryptosignals.org is not a financial advisor. Do your research before investing your funds in any financial asset or presented product or event. We are not responsible for your investing results