Bitcoin (BTC/USD) Market Pushes for a Recovery
Estimated Reading Time: 3 minutes
Don’t invest unless you’re prepared to lose all the money you invest. This is a high-risk investment and you are unlikely to be protected if something goes wrong. Take 2 minutes to learn more

Free Crypto Signals Channel
Bitcoin Price Prediction – March 16
Recently, variant downing motions feature in the BTC/USD trade activities to find support. Presently, the crypto-economic market pushes for a recovery in the trading zones of a bearish setting outlook. The crypto’s price capacity percentage rated around 4.08 positives as it trades between the high of $41,676 and a low of $38,899.
BTC/USD Market
Key Levels:
Resistance levels: $42,500, $45,000, $47,500
Support levels: $37,500, $35,000, $32,500
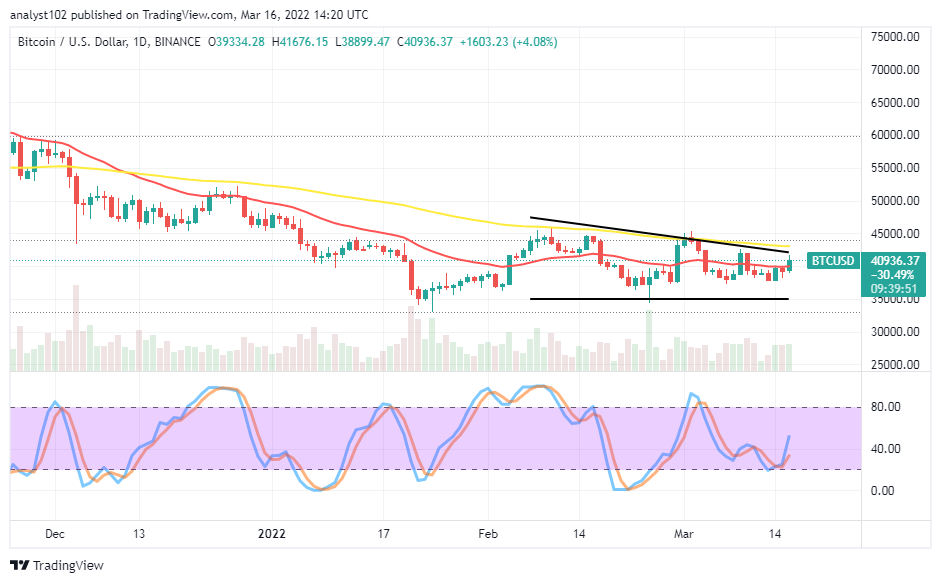
BTC/USD – Daily Chart
The BTC/USD daily chart shows the crypto-economic market pushes for a recovery as the motion to the upside has faced an abrupt resistance, leading to a timely reversal. The bigger SMA is near above the bearish trend line drawn with a baseline at $35,000 to form a descending triangular pattern, affirming that the bearish setting outlook is still until now. The 14-day SMA is underneath the 50-day SMA. The Stochastic Oscillators are trying to point northbound a bit away from the range of 40.
Will the BTC/USD trade activities hold more in the descending triangular pattern as the crypto market pushes for recovery within it?
Much is to happen in the BTC/USD trade descending triangular pattern that has featured over time as the crypto-economic market pushes for a recovery. The pointing of the Stochastic Oscillators toward the north side portends that some forces are somewhat in the making as long as the bearish trend line with the 50-day SMA indicator line is yet to be touched. Therefore, long opened position beneath the psychological trading at $40,000 may leave to run higher for profits by the guiding principle of trailing approaches.
On the downside of the technical analysis, the BTC/USD market short-position takers have to be wary of a sudden fearful breakout against the resistances around the trend line of the 50-day SMA in the long-term run. The major resistant trading level yet believed to be around $45,000 if the market has to maintain strong motion in the wake of the current recovery pushes. Several rejections around the bearish trend line will give room to sell orders exertion.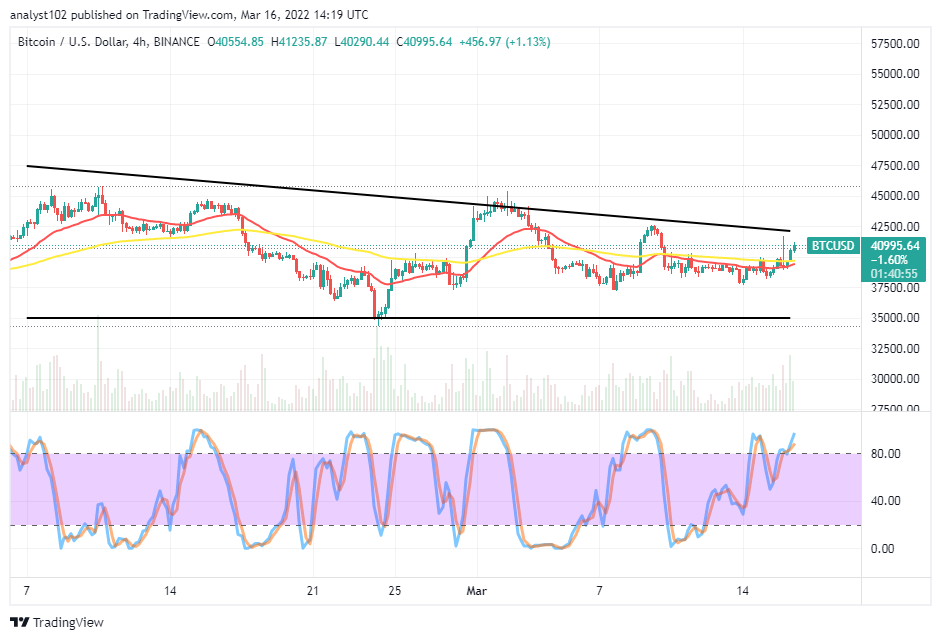 BTC/USD 4-hour Chart
The BTC/USD medium-term chart exhibits the crypto-economic market pushes for recovery within the descending triangular settings that price has kept over a couple of sessions. The 14-day SMA is attempting to move northward from the beneath of the 50-day SMA. The Stochastic Oscillators are in the overbought region, slightly pointing to the upside. That signifies the crypto is on the increase against the US Dollar. But, a loss of momentum may come into play in no time while the price encounters resistance at a higher trading spot.
Note: Cryptosignals.org is not a financial advisor. Do your research before investing your funds in any financial asset or presented product or event. We are not responsible for your investing results.
You can purchase Lucky Block here. Buy LBlock: