Bitcoin (BTC/USD) Market Pushes to the Downside
Estimated Reading Time: 3 minutes
Don’t invest unless you’re prepared to lose all the money you invest. This is a high-risk investment and you are unlikely to be protected if something goes wrong. Take 2 minutes to learn more
Bitcoin Price Prediction – November 17
The market operation of BTC/USD currently pushes to the downside, having reached some higher resistances in the last couple of trading days; sessions. The crypto-economic price keeps the trading pace at around $59,175 at a negative percentage rate of about 1.83 as of writing. The market has to move down to trade around the vital psychological baseline trading zone, as once witnessed in the previous sessions.
BTC/USD Market
Key Levels:
Resistance levels: $65,000, $70,000, $75,000
Support levels: $57,500, $55,000, $52,500
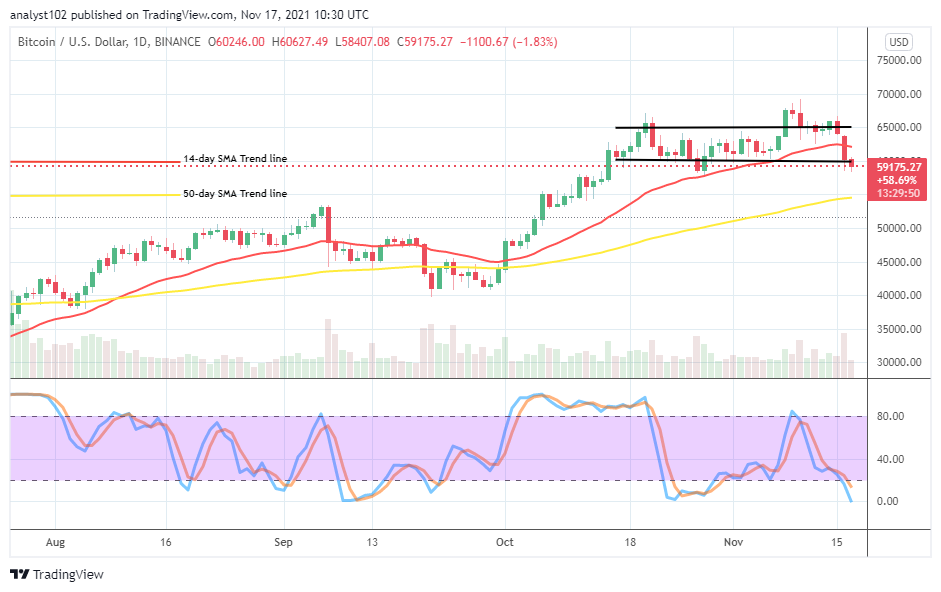
BTC/USD – Daily Chart
The BTC/USD daily chart reveals that the crypto market pushes to the downside after losing the momentum closely beneath the resistance level of $70,000 during the late trading situation at a higher spot. It again appears that the trading operations have resulted back to trade in one of its former range zones as the upper range-line drew at $65,000 and the lower range-line drew at $60,000. The 14-day SMA trend line is within those range value points above the 50-day SMA trend line. The Stochastic Oscillators are in the over oversold region, touching the zero range line. That could mean that the market has got to a support level that price can get set for an upswing.
Is there the possibility that the BTC/USD price can move down more beneath $60,000 as the crypto-economic market pushes to the downside?
Some degrees of cautiousness is needed to exercise if traders should follow the current depression trend. Presently, the BTC/USD market pushes to the downside, considering that the trading cycle is still in its bullish outlook time. It would be psychologically ideal for the trade bulls to get prepared to look out for decent buying entries from lower zones.
On the downside of the technical analysis, the BTC/USD trade bears have to consolidate their positions around the lower range line at $60,000 to gain more holds of the business activities when bulls fail to re-build their muscles at that trading capacity. The sudden emergence of a bearish candlestick could nudge the market bears for quick profiteering on a lighter note.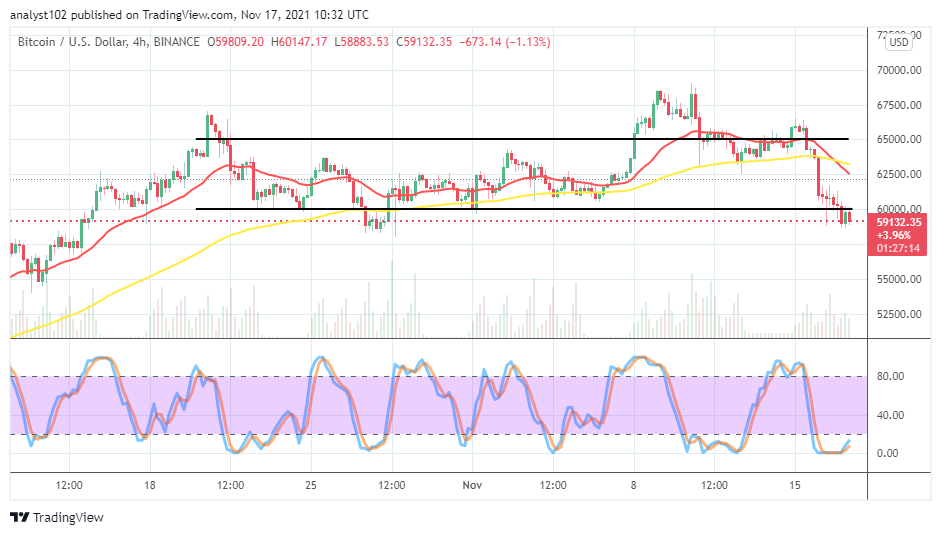
BTC/USD 4-hour Charts
The BTC/USD 4-hour chart exhibits that the crypto-economic market pushes to the downside to get a line of price convergences a bit beneath the range-line at $60,000. The 14-day SMA indicator has intercepted the 50-day SMA indicator from the top. And they are above the current trading zone. The Stochastic Oscillators are in the oversold region, with the lines crossed northbound briefly beneath the range of 20. That suggests that the crypto’s price has paused, trying to decide on the next direction. Expectedly, a bullish candlestick may soon form to signify the probability of an upward motion returning in the market in the near time.
Note: Cryptosignals.org is not a financial advisor. Do your research before investing your funds in any financial asset or presented product or event. We are not responsible for your investing results.
You can purchase crypto coins here. Buy Tokens