Bitcoin (BTC/USD) Market Retraces Position
Estimated Reading Time: 3 minutes
Don’t invest unless you’re prepared to lose all the money you invest. This is a high-risk investment and you are unlikely to be protected if something goes wrong. Take 2 minutes to learn more
Bitcoin Price Prediction – August 18
The BTC/USD market retraces position from a higher trading zone of around $47,500 resistance. The crypto’s trading line is at $45,871 at a percentage rate of about 1.22.
BTC/USD Market
Key Levels:
Resistance levels: $47,500, $50,000, $52,500
Support levels: $42,500, $40,000, $37,500
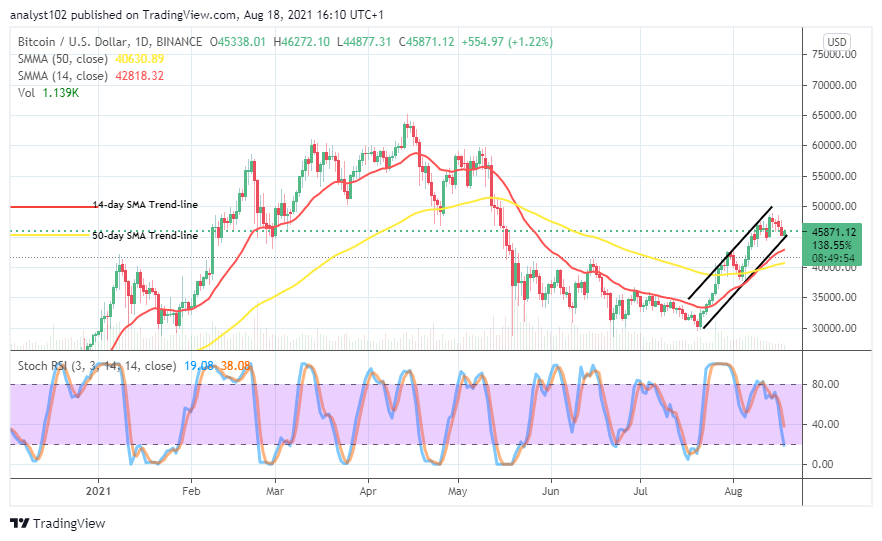
BTC/USD – Daily Chart
The daily trading chart shows that the BTC/USD market retraces position within the purview of bullish channel trend lines. During the 17th day’s session, a bearish candlestick formed close to $45,000. The placement of the SMA trend lines below the current trading market value signals that buying spree hasn’t lost out. The 50-day SMA indicator is underneath the 14-day SMA indicator. The Stochastic Oscillators have crossed southbound, nearing the range of 20. That suggests that a line of falling forces is somewhat ongoing.
The BTC/USD market retraces position, could there now be a continued price downward movement?
Only a sudden and fearful downward break of the $45,000 line will clear the grand for a continued downward movement as the market retraces position. That said, today’s session seems slightly beefing up support from the point mentioned earlier. If the session eventually ends up with a bullish candlestick formation, it would mean a brighter signal for an uptrend returning.
On the downside, the lower bullish channel trend-line needed to breach southward at the level of $45,000. And, also the BTC/USD market bears should force-hold price below that point to gain more visible lower-points of the crypto economy. Meanwhile, a chain of price consolidation may as well have to play out around that trading line before a reliable return of downward movement could be freely established.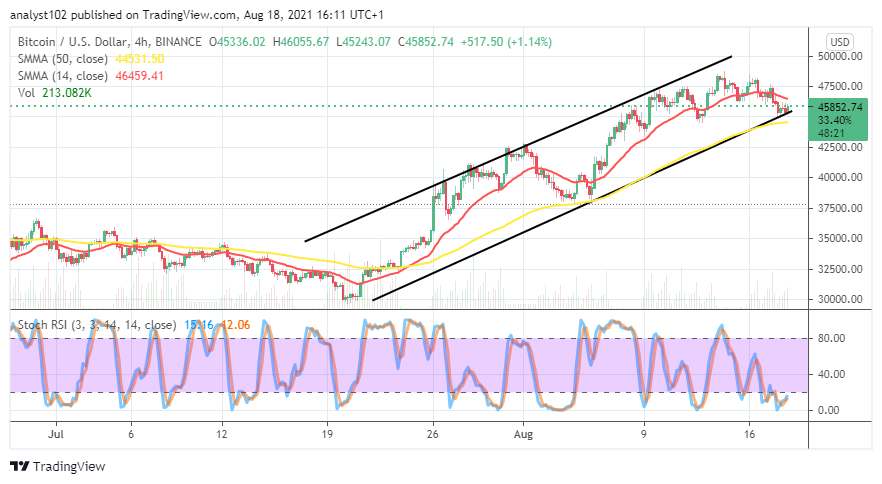
BTC/USD 4-hour Chart
The BTC/USD 4-hour chart shows that the crypto market retraces position in the ranges of $47,500 and $45,000. The bullish channel trend lines embodied the SMA trend lines. The 50-day SMA indicator trends alongside the lower bullish channel trend-line below the 14-day SMA indicator. The Stochastic Oscillators are in the oversold region. They show sign of consolidating within it. That portends that traders should be wary of exerting an order at this time.
Note: Cryptosignals.org is not a financial advisor. Do your research before investing your funds in any financial asset or presented product or event. We are not responsible for your investing results.
You can purchase crypto coins here. Buy Tokens