Bitcoin (BTC/USD) Market Retraces Toward $20,000 Critical Line
Estimated Reading Time: 3 minutes
Don’t invest unless you’re prepared to lose all the money you invest. This is a high-risk investment and you are unlikely to be protected if something goes wrong. Take 2 minutes to learn more

Free Crypto Signals Channel
Bitcoin Price Prediction – September 14
A significant downturn has prevailed in the BTC/USD trade activities as the crypto market retraces toward the $20,000 critical line. As of the time of writing, the crypto’s price bargains between the points of $20,546.96 and $20,059.44 at an average minute positive percentage rate of 0.16.
BTC/USD Market
Key Levels:
Resistance levels: $25,000, $27,500, $30,000
Support levels: $17,500, $15,000, $12,500
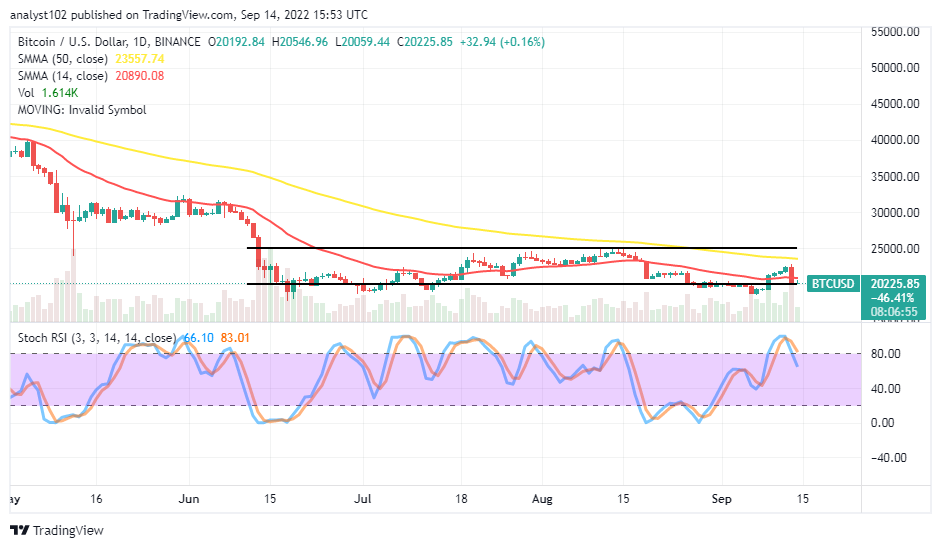
BTC/USD – Daily Chart
The BTC/USD daily chart showcases the crypto-economic market retraces toward the $20,000 critical line. The lower horizontal line drew to mark the spot for placement under a watchful eye. The range-bound zones are yet to maintain three different points $25,000, $22,500, and the value point mentioned earlier. The 14-day SMA indicator is at a $20,890.08 value line, underneath the $23,557.74 value line of the 50-day SMA indicator.
Is it technically inclined to start execution of a buy order around the $20,000 critical line now?
The BTC/USD market long-position takers need to stay off the trading activities for a while as the market retraces toward the $20,000 critical line. However, a new set of buyers with a fat account balance may risk playing along to launch a buying order while the crypto business dips a step down further from its current trading line. But, they eschew using a high lot size. For the investors, it could be the best time to come in now and add to their portfolio on a long-term basis.
On the downside of the technical analysis, yesterday’s bearish candlestick engulfed its penultimate three days of bullish candlesticks to potentially set a selling path against the 14-day SMA trend line, underneath the retard-trading level of the 50-day SMA’s point at $23,557.74. The point at the $20,000 level is liable to be breached to let the price rebuild support toward the $17,500 in the long run.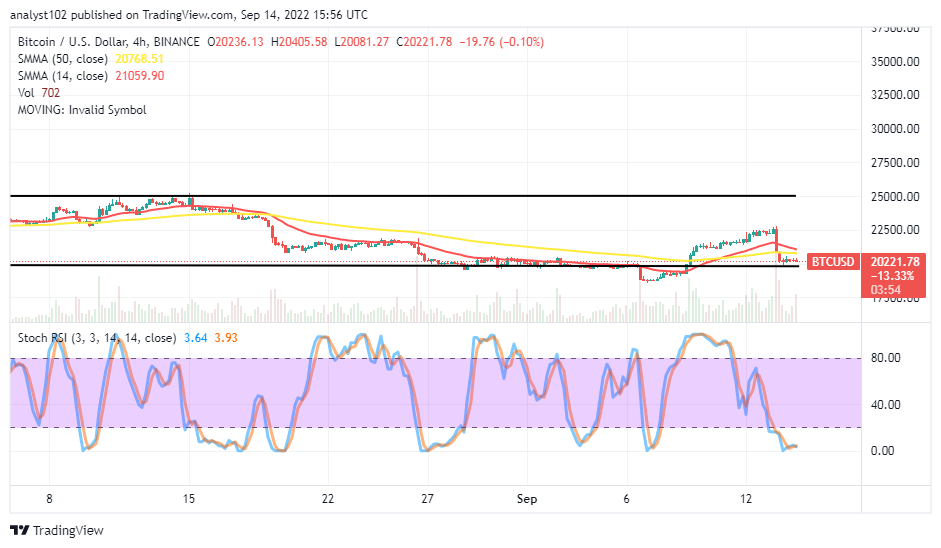
BTC/USD 4-hour Chart
The BTC/USD medium-term chart reveals the crypto market retraces toward the $20,000 critical line after hitting resistance around the mid-range point at $22,500. The 14-day SMA trend line is at $21,059.90 above the $20,768.51 value line. And they are within the range-bound zones. The Stochastic Oscillators are in the oversold region, maintaining the paces around 3.93 and 3.64 range values. Bears are relatively in the realm of losing the force systemically.
Note: Cryptosignals.org is not a financial advisor. Do your research before investing your funds in any financial asset or presented product or event. We are not responsible for your investing results.
You can purchase Lucky Block here. Buy LBLOCK