Bitcoin (BTC/USD) Market Retraces Values
Estimated Reading Time: 3 minutes
Don’t invest unless you’re prepared to lose all the money you invest. This is a high-risk investment and you are unlikely to be protected if something goes wrong. Take 2 minutes to learn more

Free Crypto Signals Channel
Bitcoin Price Prediction – April 10
The BTC/USD market operation retraces values extensively below the $45,000 line. The current trading outlook reveals a high of $42,960 and a low of $42,665, trading around $42,800 at a minute negative percentage of 0.06.
BTC/USD Market
Key Levels
Resistance levels: $45,000, $47,500, $50,000
Support levels: $40,000, $37,500, $35,000
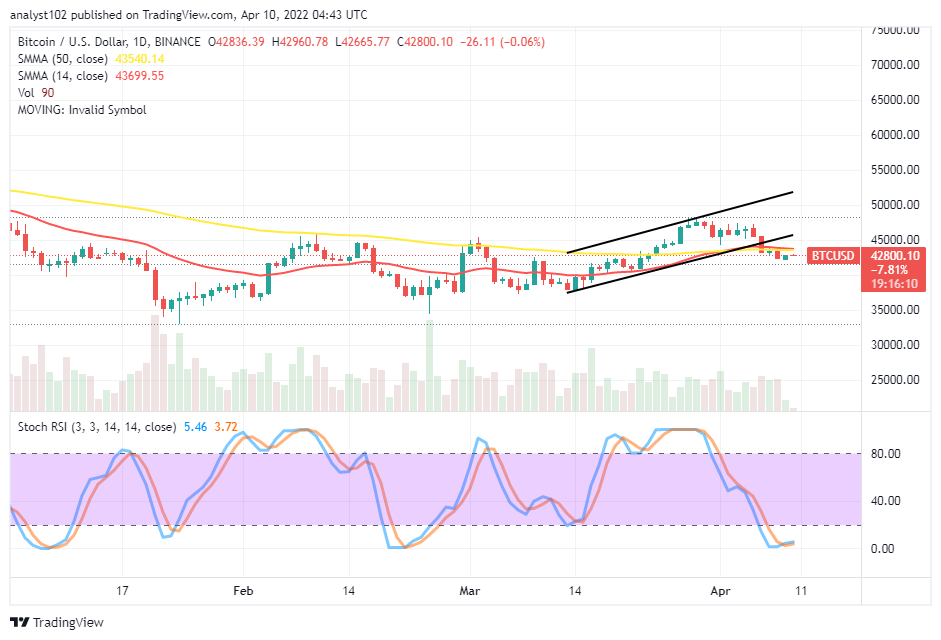
BTC/USD – Daily Chart
The BTC/USD daily chart showcases the crypto-economic market retraces values, having rallied briefly above the $47,500 resistance trading level in the last couple of several days’ sessions. The SMA trend lines are closely beneath the lower bullish trend line. The 14-day SMA indicator has conjoined with the 50-day SMA indicator closely beneath the $45,000 resistance level. The Stochastic Oscillators have dipped into the oversold region. And their lines clogged within to indicate the market is experiencing a kind of indecision playing out.
What is the trading situation like presently as the crypto market retraces values?
The BTC/USD trading situation presently showcases an oversold condition to signify that further downs to the downside may not be forthcoming easily as the market retraces values. If that assumption will have to be valid, further emergence of downs past the long-ever psychological support level at $40,000 has not to be breached sustainably to the south side afterward. Therefore, some rebounding motions will have to feature to denote a promissory degree of some upward forces.
On the downside of the technical analysis, the BTC/USD market short-position takers may not, at this point, have it smoother to push southward against the $40,000 trading level as the price has resulted in hovering around the $42,500 level. In the wake of less-active consolidation moving mode beneath the $45,000 resistance level, the market may be liable to run into a range-bound trading formation. A forceful breakdown at the support level mentioned earlier will lead the crypto trade to find another support, around the $37,500.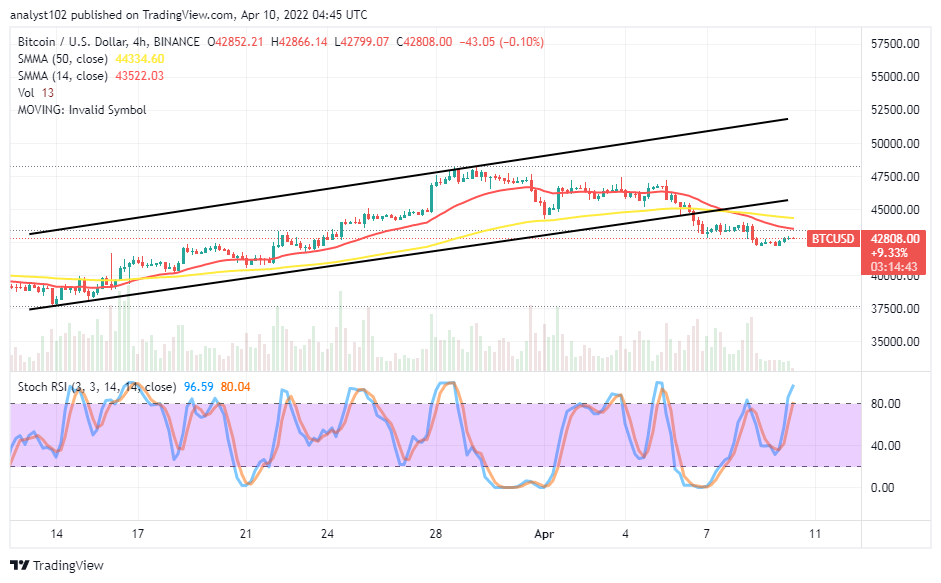
BTC/USD 4-hour Chart
The BTC/USD medium-term chart exhibits the crypto-economic market retraces values to the extent of an interception of the bigger SMA by the smaller SMA. The 50-day SMA indicator is closely above the 14-day SMA indicator. Variant smaller candlesticks have been emerging beneath the area of interception of the SMA trend lines. The Stochastic Oscillators are trying to penetrate the overbought region. Price is attempting to revisit the $45,000 resistance for a retest before returning to a downing motion. However, if the presumption doesn’t play out as speculated, a breakout of the value-line will make the market to previous higher resistances.
Note: Cryptosignals.org is not a financial advisor. Do your research before investing your funds in any financial asset or presented product or event. We are not responsible for your investing results.
You can purchase Lucky Block here. Buy LBlock: