Bitcoin (BTC/USD) Market Reverts to a Downward Trend
Estimated Reading Time: 3 minutes
Don’t invest unless you’re prepared to lose all the money you invest. This is a high-risk investment and you are unlikely to be protected if something goes wrong. Take 2 minutes to learn more

Free Crypto Signals Channel
Bitcoin Price Prediction – March 6
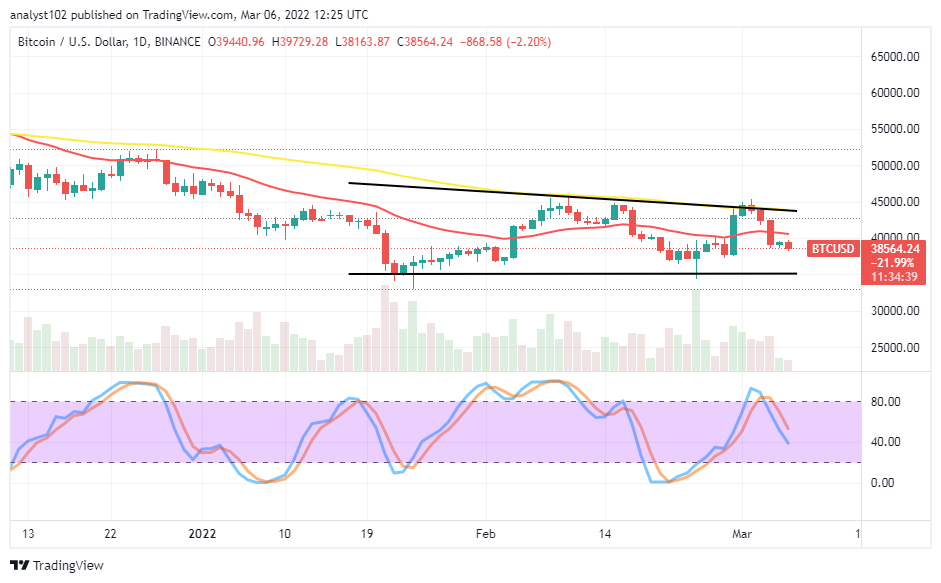
It has significantly indicated that the BTC/USD market reverts to a downward trend as the crypto economy hit resistance around a higher trading zone of $45,000 about a couple of days back. Price has resulted in a falling pressure closely beneath the resistance level of $40,000, trading around $38,564 as it keeps a percentage rate of about -2.20 as of writing.
BTC/USD Market
Key Levels
Resistance levels: $40,000, $42,500, $45,000
Support levels: $35,000, $32,500, $30,000
BTC/USD – Daily Chart
The BTC/USD daily chart showcases the crypto-economic market reverts to a downward trend, having satisfied an upward momentum gathering movement in the recent time when hitting resistance around a psychological higher trading level of $45,000. The 50-day SMA indicator is above the the14-day SMA indicator. The horizontal line drew at $35,000 to markdown the actual support trading level against the downing trend. The Stochastic Oscillators have remained to cross southbound, touching the range of 40. That suggests that a falling force is still in place.
Should traders join the move to the downside as the BTC/USD market reverts to a downward trend?
It seems not technically safe to launch sell orders as the BTC/USD market reverts to a downward trend presently. It is that the motion capacity to the downside has not been intense. A rebound can resurface in such a moving mode. Nevertheless, it still appears highly technical to wait for the downing process to reach its full line of exhaustion that believed to be around the $35,000 lower support level before the launching of long positions afterward.
On the downside of the technical analysis, the BTC/USD market short-position placers may need to let sell positions open above the point of $40,000 level to run furthermore provided there won’t be any aggressive rallying motion at no time suddenly. With a bearish candlestick in the making, bears appear to continue to dominate the crypto-economic business operations for a while.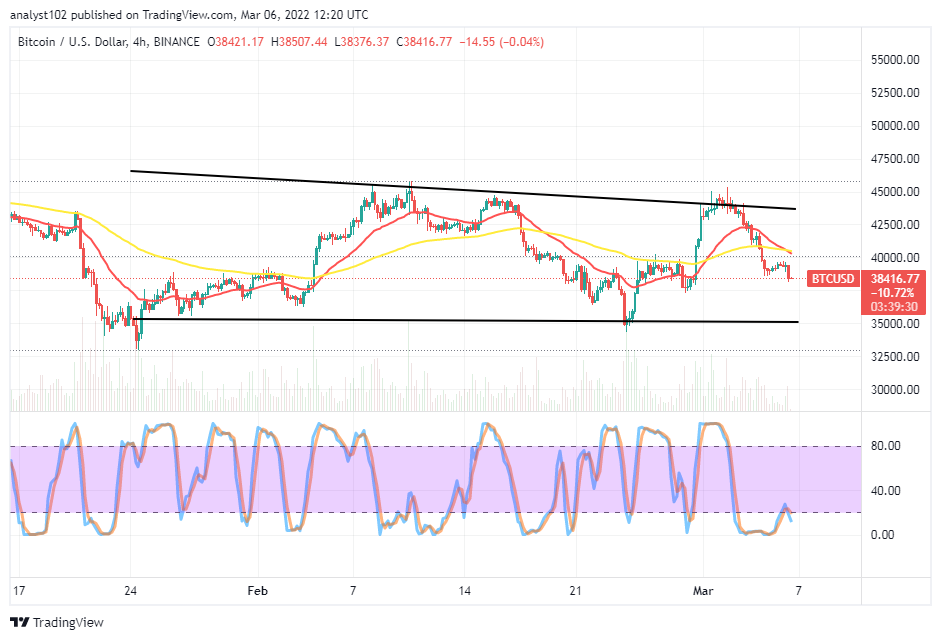
BTC/USD 4-hour Chart
The BTC/USD medium-term chart reveals the crypto-economic market reverts to a downward trend. The 14-day SMA trend line has moved from the top to touch the 50-day SMA trend line at a lower point. The Stochastic Oscillators have initially moved northbound from the oversold region to briefly past the range of 20. They have now crossed back southbound against the range spot to indicate a resumption of downing movement. The situation currently portends that some falling forces are still imminent underneath the long-outstanding resistant trading level. Therefore, long-position takers needed to exercise patience to get a suitable pattern after the downward trending pressure afterward.
Note: Cryptosignals.org is not a financial advisor. Do your research before investing your funds in any financial asset or presented product or event. We are not responsible for your investing results.
You can purchase Lucky Block here. Buy LBlock: