Bitcoin (BTC/USD) Market Trades at a Higher Psychological Spot
Estimated Reading Time: 3 minutes
Don’t invest unless you’re prepared to lose all the money you invest. This is a high-risk investment and you are unlikely to be protected if something goes wrong. Take 2 minutes to learn more
Bitcoin Price Prediction – December 1
The BTC/USD market trades at a higher psychological spot around the $57,500 line. The crypto economy’s percentage rate is estimated at about a smaller number of 0.06 to trade around $57,126 as of writing. It appears that the market is on a gradual increase moving manner.
BTC/USD Market
Key Levels:
Resistance levels: $60,000, $625000, $65,000
Support levels: $52,500, $50,000, $47,500
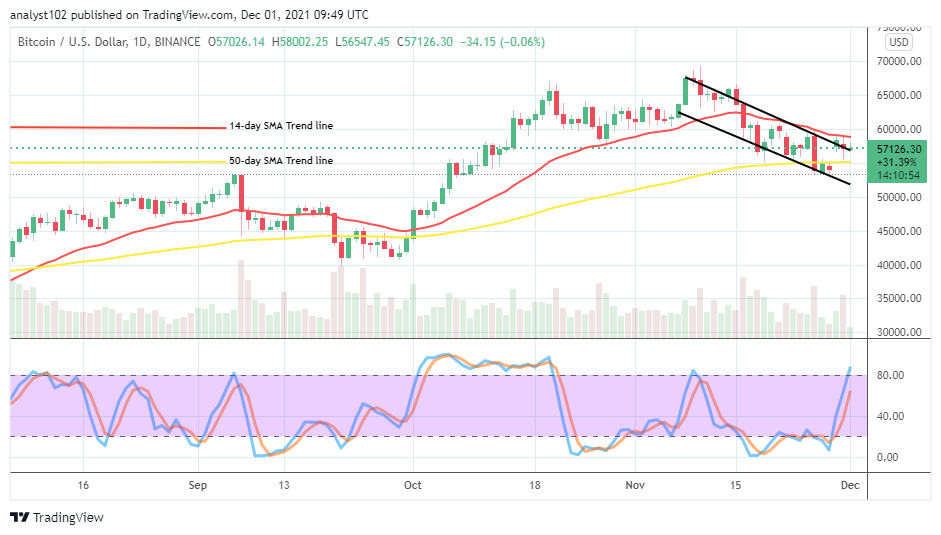
BTC/USD – Daily Chart
The BTC/USD daily chart reveals that the crypto-economic market trades at a higher psychological spot located alongside the upper bearish path close beneath the trend line of the smaller SMA. The 50-day SMA indicator is underneath the 14-day SMA indicator. The bearish channel trend lines drew to ascertain the bearish level path that price runs. The Stochastic Oscillators have moved the blue line briefly into the overbought region, with the other one pointing toward the northbound. That suggests that some northward pressures are ongoing in the market operations.
Will the BTC/USD price get pushed further to the north side as the market trades at a higher psychological spot?
A fearful breakout is needed to emerge against the $57,500 level to let in further northward pushes as the BTC/USD market trades at a higher spot. That scenario may not happen in the near time if the two market movers, at that trading capacity, maybe buy time to determine when to move in. About getting a decent buying order, some smaller-pull downs may have to be beneath the trend line of the upper bearish channel before launching of long order can exert.
On the downside of the technical analysis, the positioning of the 14-day SMA indicator on the trading chart suggests a line of variant resistances are lined-up around the levels of $57,500 and $60,000 in extension against the subsequent possible upsurges in the crypto activities. So, therefore, short-position takers may tend to rebuild energy around those value lines, making surging higher of the crypto business activities uneasy.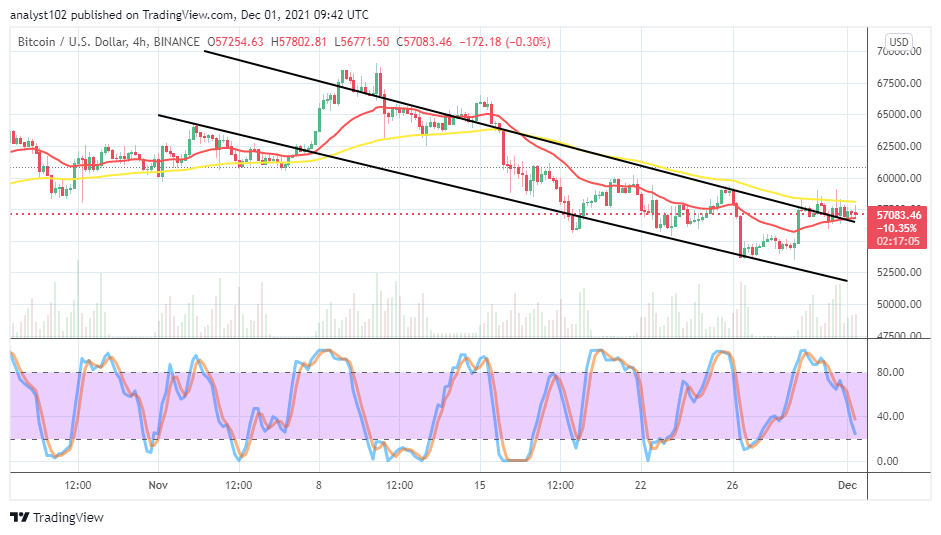
BTC/USD 4-hour Charts
The BTC/USD 4-hour chart shows that the crypto-economic market trades at a higher psychological spot between the trend lines of the SMAs. Most of the smaller trading candlesticks been forming in the market appear close over the upper trend line of the bearish channel. There is a small space separating the indicators as the 50-day SMA is above the 14-day SMA. The Stochastic Oscillators are southbound traveling, near above the range of 20. That indicates that the crypto’s valuation holds relatively to depression around $57,500. And, if it gets more heightening, the depression impact could force back the market to revisit lower trading zones between $55,000 and $52,500 in the long run.
Note: Cryptosignals.org is not a financial advisor. Do your research before investing your funds in any financial asset or presented product or event. We are not responsible for your investing results.
You can purchase crypto coins here. Buy Tokens