Bitcoin (BTC/USD) Market Turns Positive, Making a Rallying Path
Estimated Reading Time: 3 minutes
Don’t invest unless you’re prepared to lose all the money you invest. This is a high-risk investment and you are unlikely to be protected if something goes wrong. Take 2 minutes to learn more
Bitcoin Price Prediction – March 27
After a necessary retracement in the market activities of Bitcoin versus the valuation of the US dollar, the crypto market now turns positive, making a rallying path.
Many other types of candlesticks have been used to depict the ups and downs, indicating that most velocities are essentially rising rather than experiencing more lows. With the middle Bollinger Band trend line in focus and not breaking to the south, the rate of gravitational movement pressure has to be gradually increasing and moving upward for some time.
BTC/USD Market
Key Levels:
Resistance levels: $75,000, $77,500, $80,000
Support levels: $60,000, $57,500, $55,000
BTC/USD – Daily Chart
The BTC/USD daily chart shows that the crypto business currently turns positive, making a rallying path to the previous higher value.
A firmer bouncing force that is tenable on today’s candlestick could be a base toward propelling the price to the upper Bollinger Band trend line that is equating to the first point acquired as an all-time point. The stochastic oscillators have been systemically repositioning from lower zones. 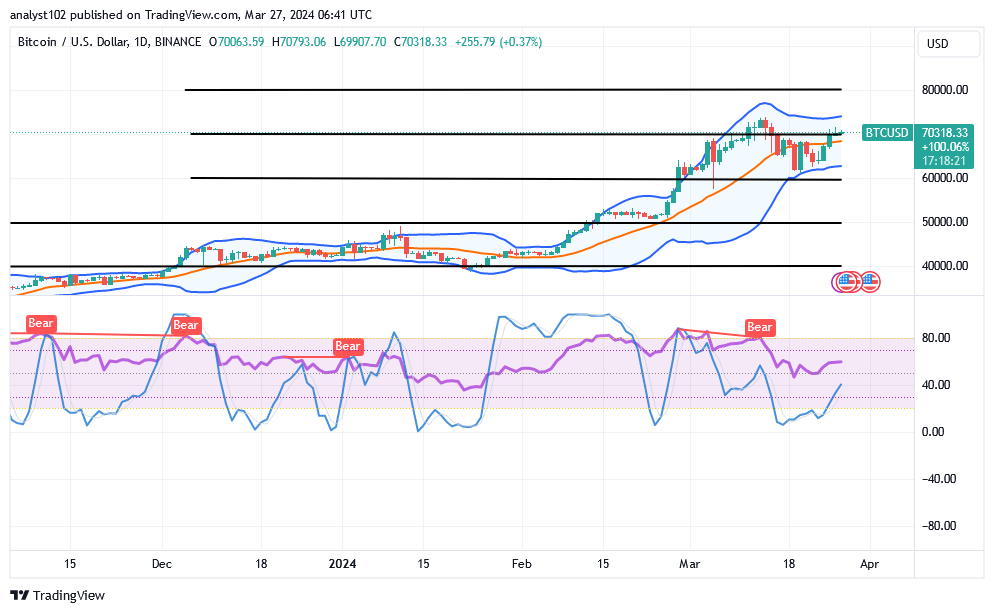
Should bulls be afraid to buy against the assumed dips that follow if bears in the BTC/USD trade tend to press against the lower Bollinger Band?
As the expectation is on the rise for the bullish trading cycle to take its full course, if the BTC/USD market tends to pull back against the lower Bollinger Band, it will be a good time to re-invest, given that the price turns positive, making a rallying path.
By closely examining the position and posture of the stochastic oscillators, it is still suggested that some catalyst recuperation is continuing. Placers in long positions would have to exit their positions from around the lower Bollinger Band if that assumption is correct.
Waiting for a rejection at the upper Bollinger Band would be a smart psychological trade strategy for bears before turning back to obtaining orders for shorting positions. If that scenario materializes, sellers will need to exercise caution in opposing any further northward movement.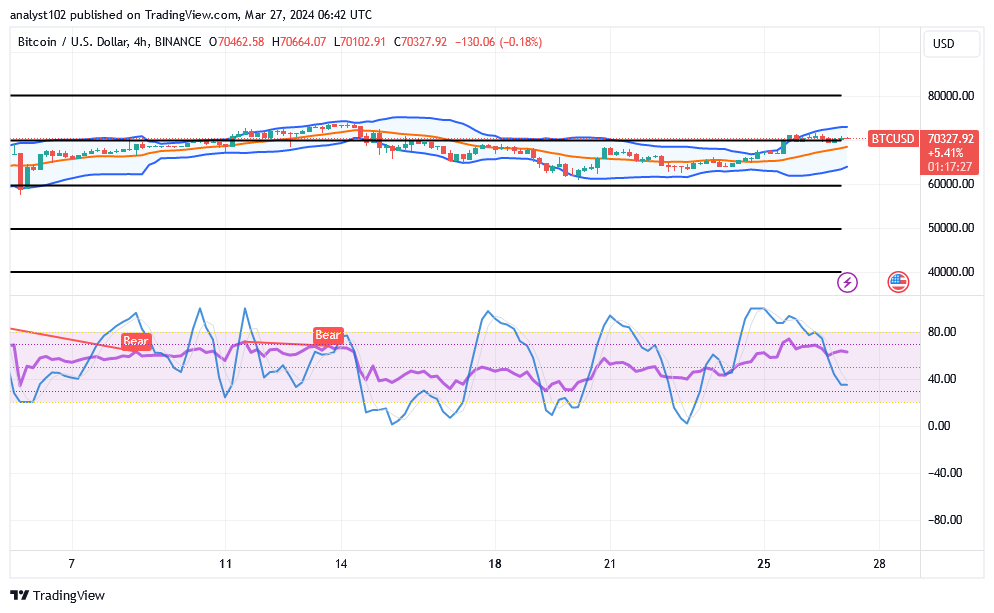
BTC/USD 4-hour Chart
The BTC/USD 4-hour chart reveals that the crypto market turns positive, making a rallying path.
Essentially, two distinct horizontal lines have been drawn, one at the lower value of $60,000 to identify the spots that the price has sprung from, and the other at the higher point of resistance of $80,000. The stochastic oscillators are approaching the line of 20 and are slightly crossing to the south. There is less of an impact from the forces on upward movements. And that can cause a brief recession in the next trading session.
Note: Cryptosignals.org is not a financial advisor. Do your research before investing your funds in any financial asset or presented product or event. We are not responsible for your investing results
You can purchase Lucky Block here. Buy LBLOCK