Bitcoin (BTC/USD) Market Witnesses Significant Dumps
Estimated Reading Time: 3 minutes
Don’t invest unless you’re prepared to lose all the money you invest. This is a high-risk investment and you are unlikely to be protected if something goes wrong. Take 2 minutes to learn more
Bitcoin Price Prediction – December 5
It has recorded on the BTC/USD financial book that the world’s first-ever crypto-economic market witnesses variant significant dumps in its valuation as placed with the US Dollar. The trading activities, as of writing, are estimated at around $49690 at a minute positive percentage rate of about 0.01.
BTC/USD Market
Key Levels:
Resistance levels: $55,000, $57,200, $60,000
Support levels: $47,500, $45,000, $42,500
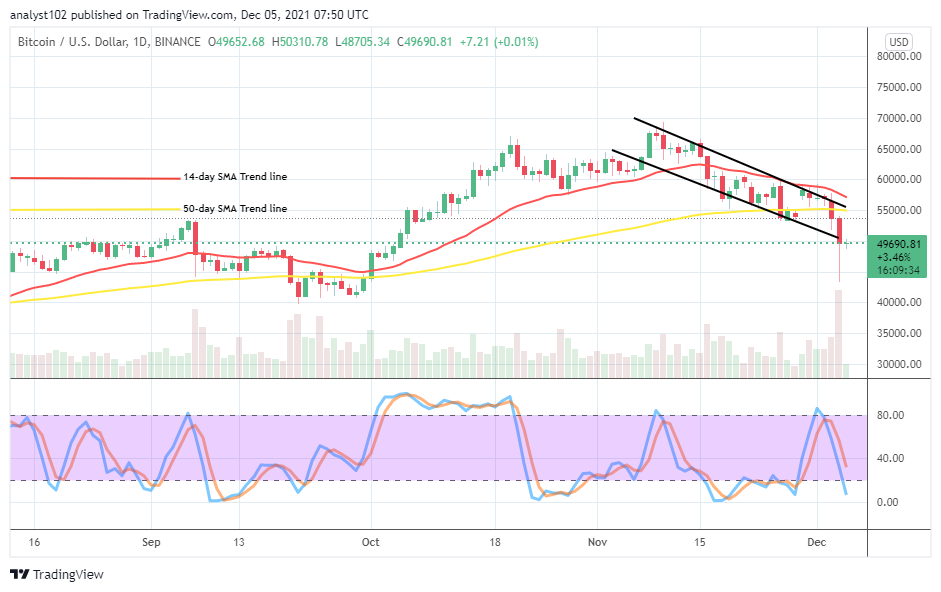
BTC/USD – Daily Chart
The BTC/USD daily chart shows that the crypto-economic price as traded with the US currency market witnesses variant significant dumps spanning from the November 29th session while the trade got resisted at the sell signal side of the smaller SMA trend line. During yesterday’s operation, a bearish candlestick emerged, breaking downward some of support trading levels after forcefully breaching the lower bearish channel trend. The bearish channel trend lines drew to ascertain the path to the downside. The 14-day SMA is above the 50-day SMA, slightly bending toward the south. The Stochastic Oscillators have freshly moved into the oversold region, indicating that the market is still somewhat in a depression trading condition.
Will there be quick recovery movements in the BTC/USD trading activities as the crypto market has witnessed significant dumps recently?
It appears that there has been a sign of rigorous price recovery movements in the BTC/USD trading activities as the crypto market has witnessed significant dumps. There has been a price upswing between $45,000 and $50,000, denoting that the market is, striving to rally against the current downward pressures. But, for the time being, those two trading levels mentioned earlier will serve as the determinants of the following directions. Price tends to build stances around the higher value-line for a while if it encounters resistance in the near time.
On the downside of the technical analysis, it may take a while before the BTC/USD market bulls can push back northward to fill the space between $50,000 and $55,000. Based on that sentiment, some pressures are still likely to feature are around those points in favor of bears. Being as it is, the market trading level of $42,500 presently appears as the critical support baseline.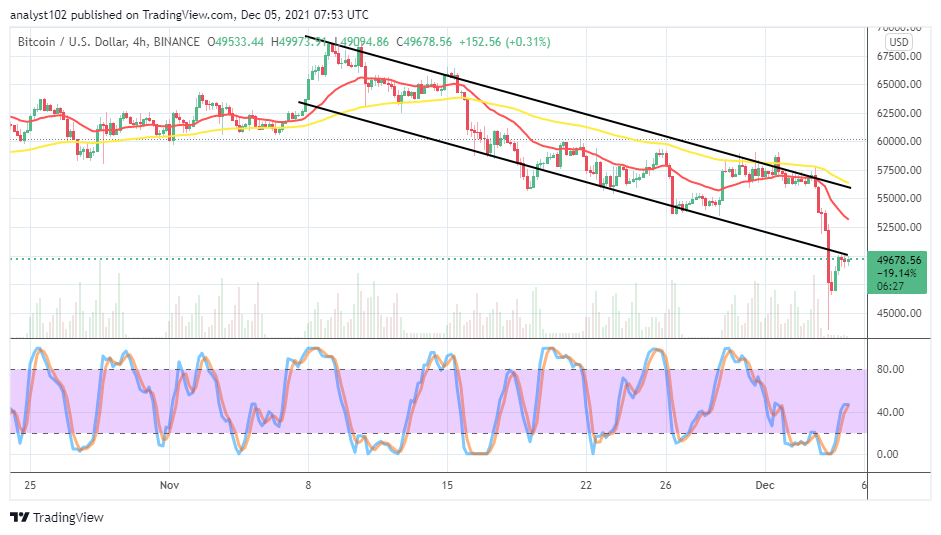
BTC/USD 4-hour Chart
The BTC/USD medium-term chart reveals that the crypto market witnesses variant significant dumps to the extent of fearfully breaching downward past the lower bearish trend line. The 14-day SMA indicator has been primarily trending southward beneath the 50-day SMA indicator to signify the presence of a depressive effect on the market. The Stochastic Oscillators have moved northbound from the oversold region, briefly past the range of 40 to now try to close the lines. That suggests that the market is trying to make a pit stop before considering the subsequent directions around the $50,000 level.
Note: Cryptosignals.org is not a financial advisor. Do your research before investing your funds in any financial asset or presented product or event. We are not responsible for your investing results.
You can purchase crypto coins here. Buy Tokens