Bitcoin (BTC/USD) Price Bargains Below a Higher $50,000 Resistance
Estimated Reading Time: 3 minutes
Don’t invest unless you’re prepared to lose all the money you invest. This is a high-risk investment and you are unlikely to be protected if something goes wrong. Take 2 minutes to learn more

Free Crypto Signals Channel
Bitcoin Price Prediction – April 3
There have been continual upward-swinging attempts in the BTC/USD market activities as the crypto-economic price bargains below a higher $50,000 resistance trading line. As of writing, the crypto economy trades around $46,419 at a percentage rate of 1.20 positives.
BTC/USD Market
Key Levels
Resistance levels: $47,500, $50,000, $52,500
Support levels: $42,500, $40,000, $37,500
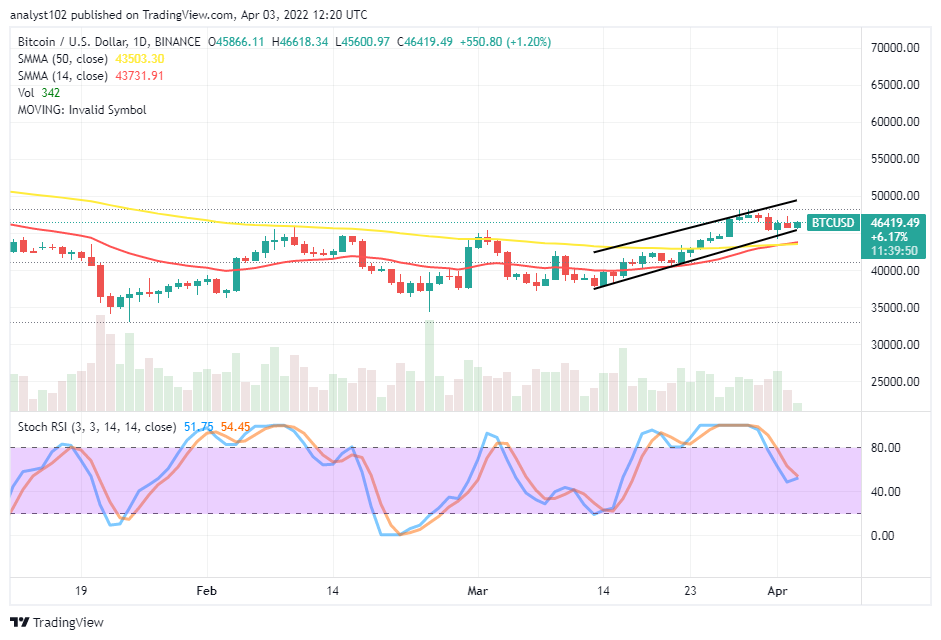
BTC/USD – Daily Chart
The BTC/USD daily chart showcases the crypto-economic price bargains below a higher $50,000 resistance level. The bullish trend line drew northward to ascertain the movements to the upside. The 14-day SMA indicator has moved upward to join the 50-day SMA indicator at a value-line of $44,000 underneath the current variant candlesticks featuring closely above the point. The Stochastic Oscillators are down to around the range of 50 in an attempt to close.
Can there be more ups in the BTC/USD market activities as the crypto-economic price bargains below a higher $50,000 resistance level?
The trading outlook of the BTC/USD market activities suggests that there can still be more featuring of ups as the crypto-economic price bargains below a higher $50,000 resistance trading level. Bulls may still find support around the $44,000 level if not forcefully breached to the downside. A sharp touch of the value-line may give birth back to a return of upward motions toward achieving higher values around the $50,000 afterward.
On the downside of the technical analysis, the BTC/USD market bears have to continue to play along with the market possibility of witnessing a reversal force against the upward momentum over the SMA trend lines. A downward against the $45,500 may lead the crypto trade to a long-term downing process. All in all, the highly placed critical trading spot is at the $50,000 resistance level.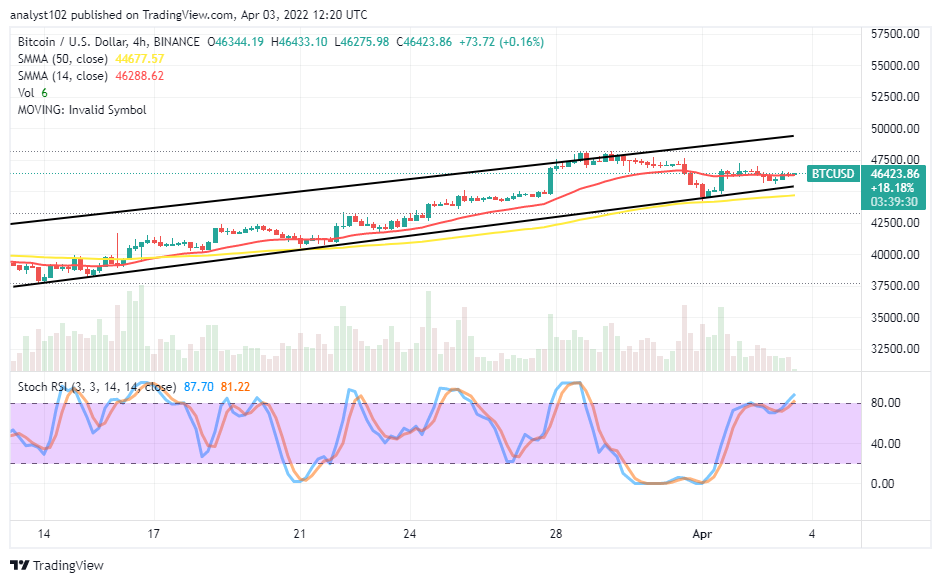
BTC/USD 4-hour Chart
The BTC/USD medium-term chart shows the crypto-economic price bargains below a higher $50,000 resistance level. The trending outlook shows that the crypto is bullish at the expense of the US Dollar’s improper purchasing power. The 14-day SMA indicator is above the 50-day SMA indicator. And they are facing the northward direction. The Stochastic Oscillators are around the range 80, trying to point northbound to signify that some degrees of buying force are ongoing. A break of the $47,500 will lead the price toward achieving a high point, once again, closer to the resistance value-line mentioned earlier at the beginning of this analytics write-up.
Note: Cryptosignals.org is not a financial advisor. Do your research before investing your funds in any financial asset or presented product or event. We are not responsible for your investing results.
You can purchase Lucky Block here. Buy LBlock: