Bitcoin (BTC/USD) Price Breaks Out at the Upper Bearish Channel
Estimated Reading Time: 3 minutes
Don’t invest unless you’re prepared to lose all the money you invest. This is a high-risk investment and you are unlikely to be protected if something goes wrong. Take 2 minutes to learn more
Bitcoin Price Prediction – December 22
It is presently on the BTC/USD financial business book that the crypto-economic price breaks out at the upper bearish channel to trade around $49,249. The market’s rate of percentage is at a minute positive 0.39.
BTC/USD Market
Key Levels:
Resistance levels: $52,500, $55,000, $57,500
Support levels: $45,000, $42,500, $40,000
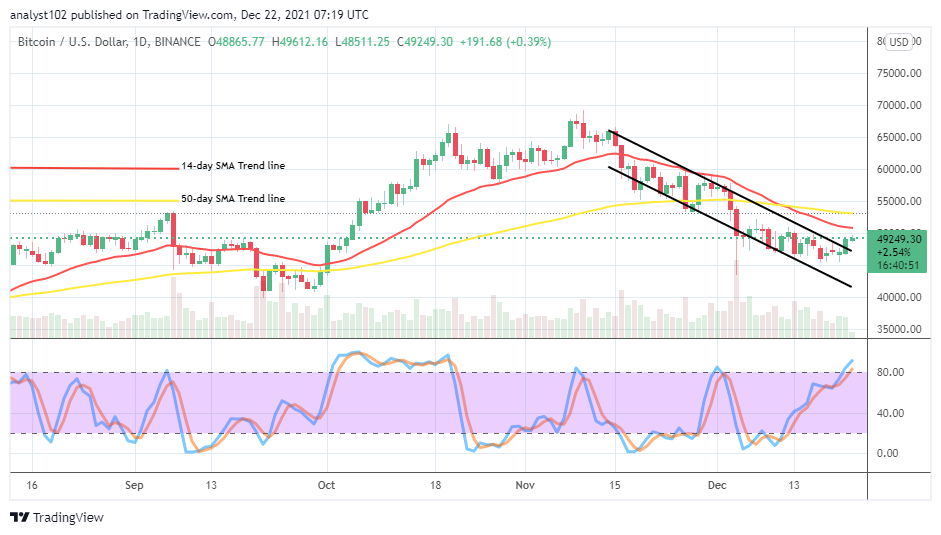
BTC/USD – Daily Chart
The BTC/USD daily chart showcases currently that the crypto-economic price breaks out at the upper bearish channel, making the market approach resistance at $50,000. The 14-day SMA indicator is closely above the value line beneath the 50-day SMA indicator. The Stochastic Oscillators are somewhat slantingly diving into the overbought region. And they still point toward the northbound in the overbought region to indicate that some upward pressures are ongoing in the crypto-economic trade operations.
Is it safe to continue to go longing positions in the BTC/USD current market’s condition as the crypto-economic price breaks out at the upper bearish channel?
Quite a lot of effort would still have to be put in place by the BTC/USD traders as the crypto-economic price breaks out at the upper Bearish channel to signify an intrigue of upward motions returning in the operations. As the situation portends, it also appears that the market may still have to gather some more strengths around $50,000 even after there might have an occurrence of a further break-out trading condition afterward.
On the downside of the technical analysis, the BTC/USD short-position takers needed to intensify efforts when the price tends to expose to several rejections around the trend line of the 14-day SMA before considering other sell orders. That assumption may come to play out of active price action signifying by a bearish candlestick formation around the $50,000 trading level to create a selling wall. On the contrary, a slow-moving method to the upside may dominate the market to cause dicey entries for positions for a while around the value line.
BTC/USD 4-hour Charts
The BTC/USD medium-term chart reveals that the crypto-economic price breaks out at the upper bearish channel, extending the pushes around the trend line of the bigger SMA. The 14-day SMA indicator is underneath the 50-day SMA indicator, trying to bend northward. The Stochastic Oscillators are in a conjoined moving outlook, trying all efforts to point toward the northbound within it. That indicates that the crypto-economic market’s worth is increasingly, against the valuation of the US currency.
Note: Cryptosignals.org is not a financial advisor. Do your research before investing your funds in any financial asset or presented product or event. We are not responsible for your investing results.
You can purchase crypto coins here. Buy Tokens