Bitcoin (BTC/USD) Price Briefly Breaks Down at $20,000
Estimated Reading Time: 3 minutes
Don’t invest unless you’re prepared to lose all the money you invest. This is a high-risk investment and you are unlikely to be protected if something goes wrong. Take 2 minutes to learn more

Free Crypto Signals Channel
Bitcoin Price Prediction – September 21
It has again come to be that the BTC/USD market price briefly breaks down at the $20,000 psychological line. The current trading zones have witnessed a low and a high of $19139.69 and a low of 18802.70 at a minimally minute negative average percentage rate of 0.02.
BTC/USD Market
Key Levels:
Resistance levels: $22,500, $25,500, $27,500
Support levels: $17,500, $15,000, $12,500
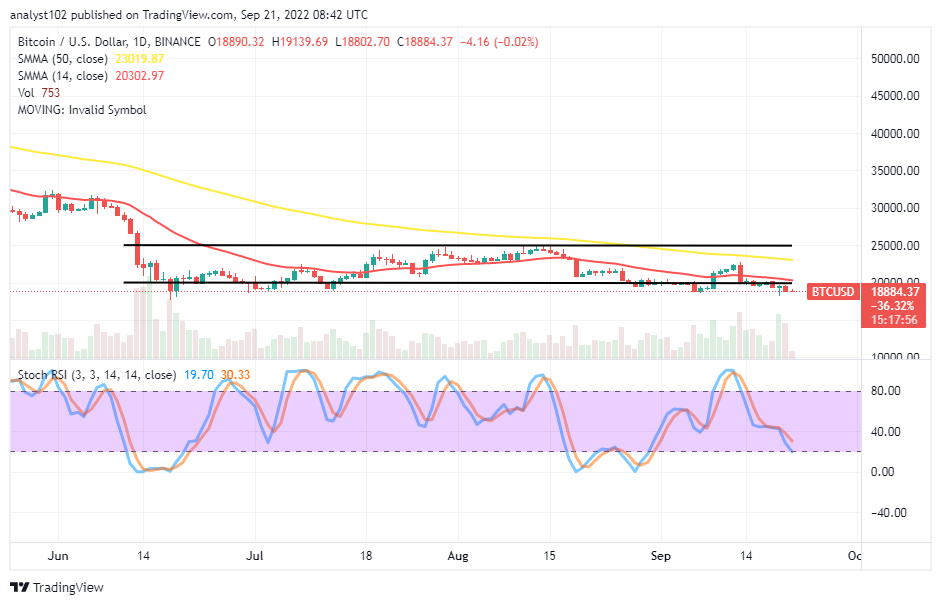
BTC/USD – Daily Chart
The daily chart reveals that Bitcoin’s market strength price briefly breaks down at the $20,000 logical level around the lower horizontal line drawn. The 14-day SMA indicator is at $20,302.97, closely above the value line in question and underneath the $23,019.87 value point of the 50-day SMA indicator. The Stochastic Oscillators have crossed southbound against the 40 range to place at 30.33 and 19.70 range values.
Will the BTC/USD market valuation feature long underneath the $20,000 level?
The BTC/USD market for keeping long below the $20,000 critical level will be if no bullish candlestick forms at any time within the lower support levels that the price is currently pushing through as the crypto trade breaks down briefly from the value line recently. Long-position placers have to be wary of executing a new order against the current declining force without letting in a formation of about two bullish candlesticks of a 1-hour time frame form to consider a buying order afterward.
On the downside of the technical analysis, the BTC/USD market bears need to embark upon a consolidation moving mode that will intensely put the price under further falling pressure below the $20,000 level. It may be technically ideal for that short-position placers to follow a powerful motion once spotted at an early stage. And they also have to protect their execution order by using a stop loss order almost immediately.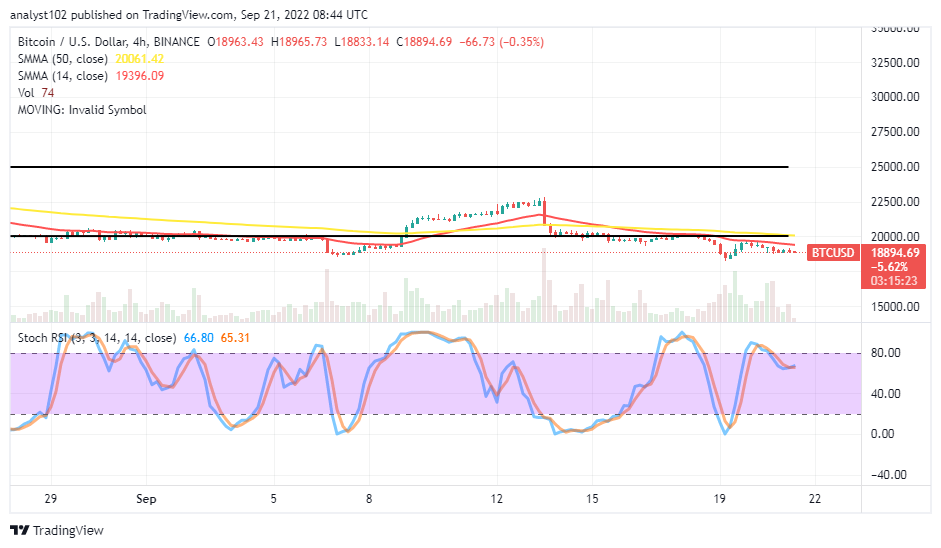
BTC/USD 4-hour Chart
The BTC/USD medium-term chart portrays that the crypto market price breaks down at the $20,000 level in the recent trading sessions. The trading indicators are close as the 14-day SMA trend line is at $19,396.09, and the 50-day SMA trend line’s value point is at $20,061.42 above. The Stochastic Oscillators have slightly crossed southbound from the overbought region to touch 66.80 and 65.31 range points. There is the possibility that the market will hold for a while between the levels of $17,500 and $20,000. However, reading an oversold condition by the concerned trading tool will help decide a timely potential of a bullish motion to resume afterward.
Note: Cryptosignals.org is not a financial advisor. Do your research before investing your funds in any financial asset or presented product or event. We are not responsible for your investing results.
You can purchase Lucky Block here. Buy LBLOCK