Bitcoin (BTC/USD) Price Downsizes, Trying to Swing Upward
Estimated Reading Time: 3 minutes
Don’t invest unless you’re prepared to lose all the money you invest. This is a high-risk investment and you are unlikely to be protected if something goes wrong. Take 2 minutes to learn more

Free Crypto Signals Channel
Bitcoin Price Prediction – May 4
The BTC/USD market price downsizes, trying to swing upward presently. About some hours back, the crypto-economic trade witnessed a line of abrupt sell-offs closer to the $37,500 support trading line. Price has sprung upward from the low of $37,651, trading currently at about $38,433 at a percentage rate of +1.89.
BTC/USD Market
Key Levels:
Resistance levels: $40,000, $42,500, $45,000
Support levels: $37,500, $35,000, $32,500
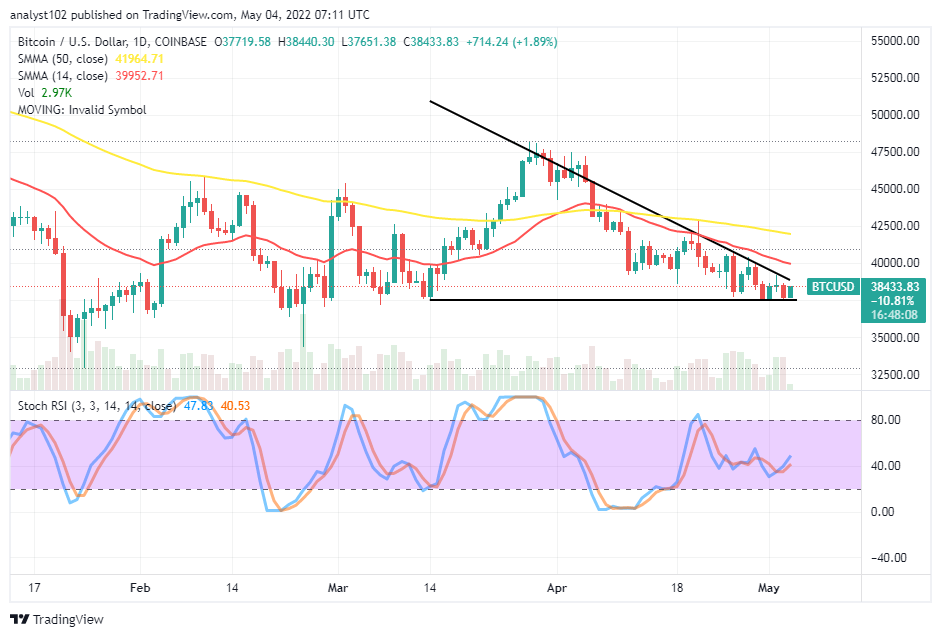
BTC/USD – Daily Chart
The BTC/USD daily chart reveals the crypto-economic price downsizes, trying to swing upward after it averaged the $37,500 support level. The 14-day SMA indicator is underneath the 50-day SMA indicator. A bullish candlestick is a beefing process toward the bearish trend line drawn briefly past the smaller SMA trend line. The Stochastic Oscillators are somewhat moving in a consolidation around the 40 range. That signifies a degree of indecision may play along in the long-term running outlook between the psychological trading points of $40,000 and $37,500.
Will the BTC/USD market push downward past the $37,500 as the crypto-economic price downsizes and is trying to swing upward?
Based on the current downward force capacity level outlook of the BTC/USD business operations, getting to sustainable lows beneath the critical support baseline of $37,500 is dicey as the crypto-economic downsides, trying to swing upward after averaging it not too long. Long-position takers may have to be on the lookout for active rebounding motion against falling forces before considering buying orders afterward.
On the downside of the technical analysis, the BTC/USD market short-position takers have a lesser advantage of pulling down the trading activities reliably beyond the $37,500 support level. An effort at breaching southward past may be too risky to bear if a bounce-off re-surfaces in no time. Therefore, it is advisable to suspend new shorting positions around that value line.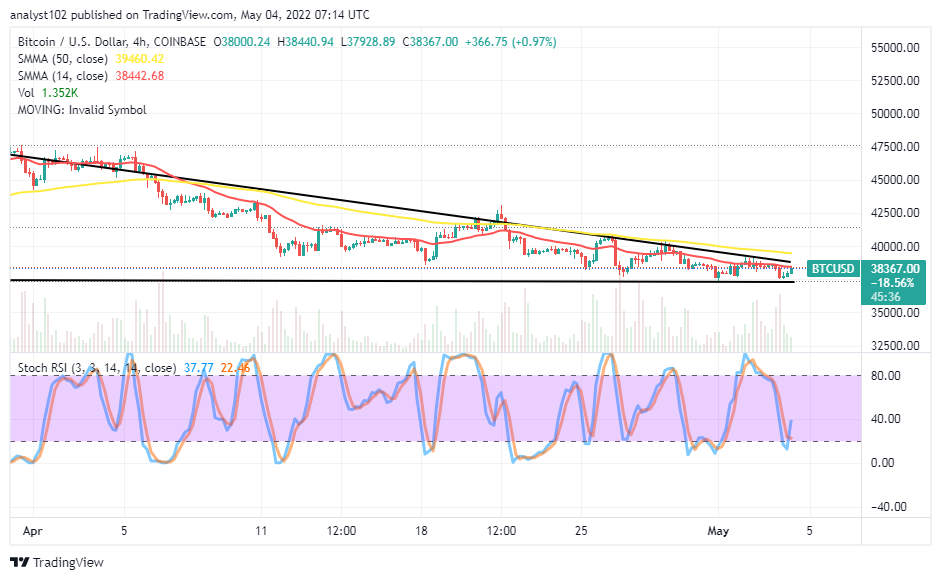
BTC/USD 4-hour Chart
The BTC/USD 4-hour chart shows the crypto-economic price downsizes, trying to swing upward from the $37,500 support level. The 14-day SMA trend line is below the 50-day SMA trend line. And they are long-drawn to the southward. The bearish trend line drew between the smaller spaces of the SMAs. The Stochastic Oscillators are trying to cross their lines northbound from the range of 20 slightly against the range of 40 to indicate some upward forces are gathering momentum. Meanwhile, it could take a while before some close-by barriers to the upward trend breach smoothly in the long-term run.
Note: Cryptosignals.org is not a financial advisor. Do your research before investing your funds in any financial asset or presented product or event. We are not responsible for your investing results.
You can purchase Lucky Block here. Buy LBlock: