Bitcoin (BTC/USD) Price Falls Significantly Past $35,000
Don’t invest unless you’re prepared to lose all the money you invest. This is a high-risk investment and you are unlikely to be protected if something goes wrong. Take 2 minutes to learn more


Free Crypto Signals Channel
Bitcoin Price Prediction – May 8
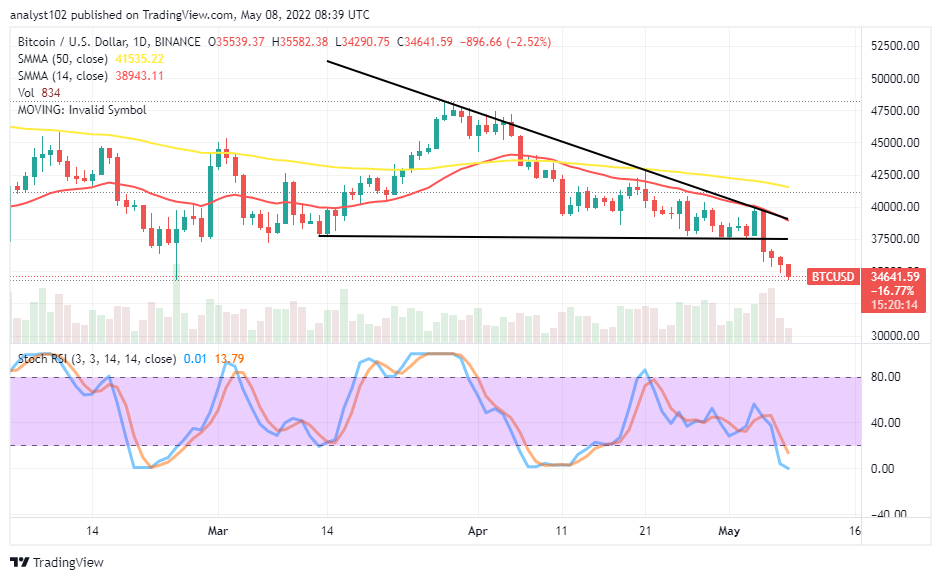
Owing to the inability of buyers to hold positions against the downing motions over a couple of sessions; the crypto-economic price now falls significantly past $35,000. Price is trading between $35,582 and $34,290 at a negative percentage rate of 2.52.
BTC/USD Market
Key Levels
Resistance levels: $37,500, $40,000, $42,500
Support levels: $32,500, $30,000, $27,500
BTC/USD – Daily Chart
The BTC/USD daily chart shows the crypto-economic price falls significantly slightly past $35,000. The horizontal line drawn at the $37,500 line shows the critical spot from where the aggressively downing process breached through in an extension of the bearish trend. The 14-day SMA indicator is underneath the 50-day SMA indicator. The Stochastic Oscillators are in the oversold region, closer to the range of zero. In the near time, some upward momentum is expected to be piling up around the value line to allow buyers a better hedge to spot a decent long position entry afterward.
Will the current aggressively downing force cause more downs as price falls significantly past $35,000?
Presently, there has no reliable sign to portend a stop in the downing motion that the BTC/USD market encounters. Therefore, some downs may still feature in the crypto economy as its price falls significantly against the US Dollar briefly past the $35,000. Long-position takers may now have to be on the lookout for a bounce-off between the value line mentioned earlier and the $32,500 support trading level to get a buying entry. This spot could also serve one of the best investment conditions.
On the downside of the technical analysis, the BTC/USD trade short-position takers may still hold stronger on the market against any buying order for a while considering the current bearish pace that price keeps. The moment a bullish candlestick tends to emerge from a deep-down trading zone, then, it will be a warning sign against getting reliable downward movements. However, if the current downing trend has to continue, bears will have to resume consolidation movements around the $35,000 for a long-term running.
BTC/USD 4-hour Chart
The BTC/USD medium-term chart reveals the crypto-economic price falls significantly past the $35,000 level. The 14-day SMA trading indicator trends southward against the $37,500 resistance level to set another lower support trading zone for the market underneath the 50-day SMA indicator which is above it. The Stochastic Oscillators have crossed southbound from the 40 range to touch the range at 20 in an erratic manner. Failure to have a rebound around the value point may the trading situation to degenerate into more panic sell-offs. But, it would be better for it, if investors keep buying the dips for holding on a long-term basis and, long-position players should avoid overleveraging while launching their orders.
Note: Cryptosignals.org is not a financial advisor. Do your research before investing your funds in any financial asset or presented product or event. We are not responsible for your investing results.
You can purchase Lucky Block here. Buy LBlock:


