Bitcoin (BTC/USD) Price Features in a Range-Bound Zone
Estimated Reading Time: 3 minutes
Don’t invest unless you’re prepared to lose all the money you invest. This is a high-risk investment and you are unlikely to be protected if something goes wrong. Take 2 minutes to learn more

Free Crypto Signals Channel
Bitcoin Price Prediction – May 29
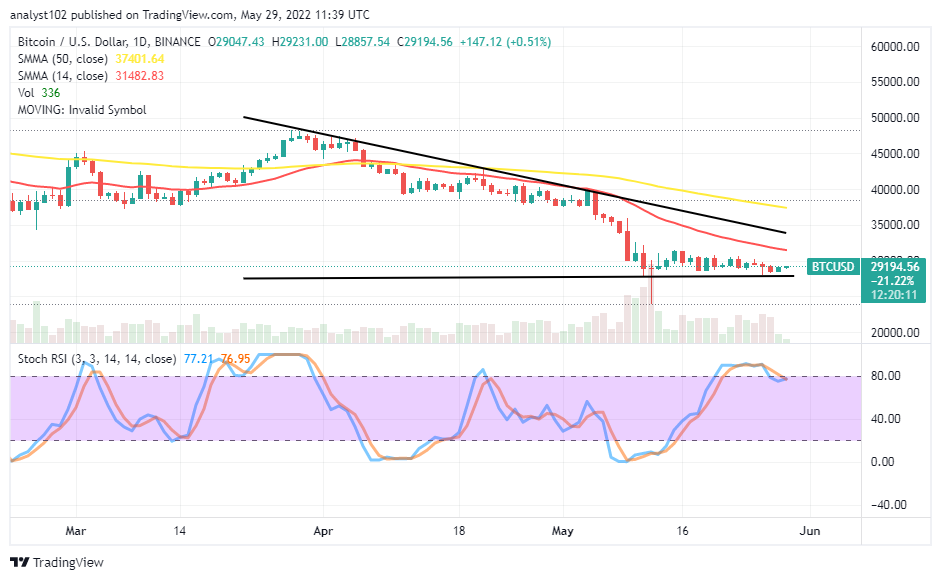
The BTC/USD trading activity has taken to a pattern that shows that it features in a range-bound zone over a couple of sessions. Price is trading around $29,194 between the high of $29,231 and the low of $28,857 at a minute positive percentage rate of 0.51.
BTC/USD Market
Key Levels
Resistance levels: $32,500, $35,000, $37,500
Support levels: $27,500, $25,000, $22,500
BTC/USD – Daily Chart
The daily chart showcases the crypto-economic price features in a range-bound zone closely above the $27,500 support level. The 14-day SMA trend line is beneath the 50-day SMA trend line. The Stochastic Oscillators have earlier conjoined within the overbought region. And they have briefly moved down against the range of 80, trying close their lines faintly back into a northbound direction around it to indicate that an upward force is playing on.
Will the BTC/USD market prolong operation in a range-bound zone?
The absence of pushes by the two trade-movers would allow the crypto-economic price features in a range-bound zone for a long time. Being as it is, the $27,500 remains the critical support level where bulls are to take their shot for energy-boosting to make or regain an up stride while price tends to breach it southward more. A sudden breakdown at the value-line for a long-holding position beneath it will endanger the chance of long-position takers to get back against the downing force for some time.
On the downside of the technical analysis, the BTC/USD market trading outlook presently doesn’t firmly indicate a haven to ride an active spring from a lower trading point in the current range-bound pattern. That said, the intensity of the downward-trending force has billed for rebuilding around the trend line of the 14-day SMA indicator to re-surface in the wake of price trying to rally for recovery afterward. Therefore, the launching of buying orders should be with the utmost trading principle of proper position management.
BTC/USD 4-hour Chart
The BTC/USD medium-term chart shows the crypto-economic price features in a range-bound zone. In a more distinct analytics talk, the range-bound outlook has an upper horizontal line drawn at a $32,500 resistance level and a lower horizontal line drawn at a $27,500 support level. The 50-day SMA is over the 14-day SMA within the two horizontal lines to affirmatively indicate the crypto economy trades in a range against the US Dollar. The Stochastic Oscillators are in the overbought region, clogging the lines within. That shows indecision is playing out now.
Note: Cryptosignals.org is not a financial advisor. Do your research before investing your funds in any financial asset or presented product or event. We are not responsible for your investing results.
“Lucky is up more than 50% today but still more than 430% from All Time Highs!
The opportunity to bank BIG is now!
You can purchase Lucky Block here. Buy LBlock: