Bitcoin (BTC/USD) Price Holds Position at Lower Range-line
Estimated Reading Time: 3 minutes
Don’t invest unless you’re prepared to lose all the money you invest. This is a high-risk investment and you are unlikely to be protected if something goes wrong. Take 2 minutes to learn more
Bitcoin Price Prediction – June 13
Over a couple of trading days’ sessions, the BTC/USD price holds position trading at a lower range-line until the present. At a rate of 0.18 percent, the crypto’s line is no trading around the level of $35,697.
BTC/USD Market
Key Levels:
Resistance levels: $40,000, $45,000, $50,000,
Support levels: $30,000, $25,000, $20,000
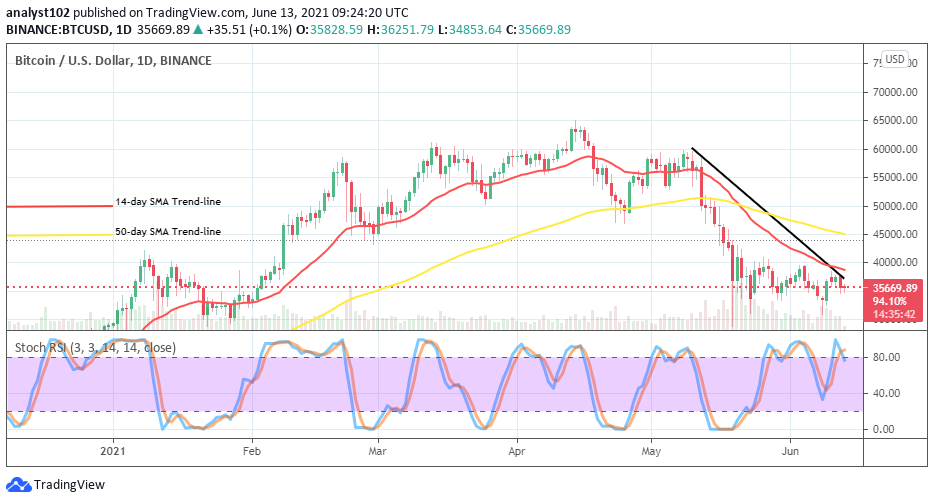
BTC/USD – Daily Chart
The BTC/USD daily chart still depicts that the lower range-line of $35,000 is intact as the crypto’s price holds the position to trade around it until the present. The bearish trend-line remains drawn across both the SMAs to the downside. The 14-day SMA trend-line is underneath the 50-day SMA indicator pointing more to the south than the east. The Stochastic Oscillators have crossed the lines slightly against range 80 from the overbought region to point southbound. That signifies that downward pressure is somewhat in the making to suggest putting a halt to smooth upward movement of the crypto economy.
The BTC/USD price holds the position at the lower range-line, will it breach down soon?
The BTC/USD price holds the position at the lower range-line seems that bulls will soon be getting variant supports from below the value of $35,000. Variant attempts being made have appeared to have proven that assumption right. In the wake of that, the market values between the point earlier mentioned and the immediate support level of $30,000 are expected to be actual support-finding zones for upward moves from that bulls will be making use to re-launch its come-back into the market.
On the downside, the Stochastic Oscillators still the trading indicator that is signaling an overbought trading situation of the crypto as of now. Therefore, bears still have the chance of pushing between the levels of $40,000 and $35,000 to establish their firmness in the crypto economy. A sudden sustainable break out of the immediate resistance level at $40,000 may not easily be achieved in the near time.
BTC/USD 4-hour Chart
On the BTC/USD 4-hour chart, it is depicted that the Stochastic Oscillators have crossed the lines from the oversold region to point toward the north near below range 40 to suggest that an upswing is ongoing in the crypto market. Although, the 50-day SMA trend-line is above the 14-day SMA trend-line as the bearish trend-line is located over the bigger SMA. The market level around $32,000 seems to be the key baseline where the crypto has been finding strong support.
Note: new.cryptosignals.org is not a financial advisor. Do your research before investing your funds in any financial asset or presented product or event. We are not responsible for your investing results.