Bitcoin (BTC/USD) Price Hovers Around $40,000
Estimated Reading Time: 3 minutes
Don’t invest unless you’re prepared to lose all the money you invest. This is a high-risk investment and you are unlikely to be protected if something goes wrong. Take 2 minutes to learn more

Free Crypto Signals Channel
Bitcoin Price Prediction – February 27
There has been a pit-stop following a rebounding motion in the BTC/USD market operations as the crypto-economic price hovers around $40,000 presently. The crypto economy is between the high of $39,277 and a low of $38,221 at a smaller negative percentage rate of 0.98.
BTC/USD Market
Key Levels
Resistance levels: $40,000, $42,500, $45,000
Support levels: $37,500, $35,000, $32,500
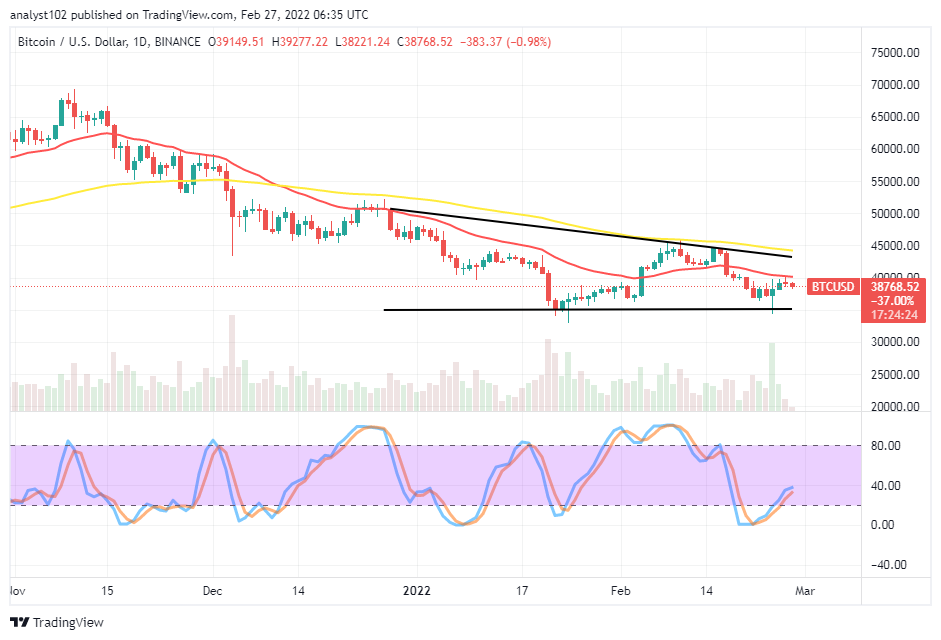
BTC/USD – Daily Chart
The BTC/USD daily chart reveals the crypto-economic price hovers around the $40,000 trading level. The 50-day SMA indicator is above the 14-day SMA indicator. The upper bearish trend line touches the psychological resistant points that price has been following to the downside. Presently, the crypto market is encountering a retardant force around the value line. The Stochastic Oscillators positioned somewhat slantingly northbound from the oversold region closely beneath the range of 40. It shows that the momentum to the upside may start getting reduced in a way.
Will the BTC/USD market still feature a bearish trading cycle as the crypto-economic price hovers around $40,000?
The BTC/USD market holds a bearish trading cycle as the crypto-economic price hovers around $40,000. Based on a technical trading approach, traders would have to be on the lookout for an area of exhaustion of a particular volatility movement before considering a launch of an order. Long-position placers may have to be cautious of exerting a position trying to find support.
On the downside of the technical analysis, the BTC/USD market short-position placers may have to continue to fall under a selling force under the trend line of the smaller SMA. The $40,000 psychological level will likely remain the zone that price has to face barriers to impede smooth runs of the market. A full-fledged bearish candlestick against the $37,500 and $35,000 levels will lead to more projections of featuring downs.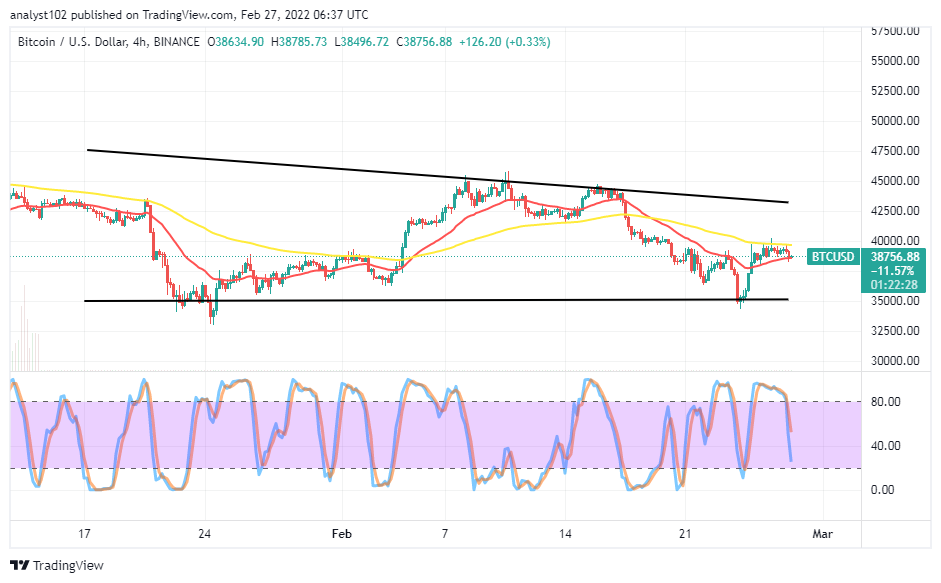
BTC/USD 4-hour Chart
The BTC/USD medium-term chart reveals the crypto-economic price hovers around $40,000. The 50-day SMA indicator is above the 14-day SMA indicator. The critical support baseline drawn at the $35,000 The Stochastic Oscillators has crossed southbound from the overbought region, moving to the downside closer to the range of 20. It appears that the crypto-economy is decreasing at a slowing rate. The present situation market needed to run into a volatile motion before observing a position.
Note: Cryptosignals.org is not a financial advisor. Do your research before investing your funds in any financial asset or presented product or event. We are not responsible for your investing results.
You can purchase Lucky Block here. Buy LBlock: