Bitcoin (BTC/USD) Price Hovers at $20,000
Estimated Reading Time: 3 minutes
Don’t invest unless you’re prepared to lose all the money you invest. This is a high-risk investment and you are unlikely to be protected if something goes wrong. Take 2 minutes to learn more

Free Crypto Signals Channel
Bitcoin Price Prediction – September 6
Buying and selling activity in the BTC/USD market has been maintaining a range of points as the price hovers at $20,000 over a long session. Price has gone a bit lower at the value line as it trades around $19,932.52, keeping a minute average percentage of 0.61 positive.
BTC/USD Market
Key Levels:
Resistance levels: $25,000, $27,500, $30,000
Support levels: $17,500, $15,000, $12,500
BTC/USD – Daily Chart
The daily chart reveals the crypto-economic price hovers around the $20,000 logical trading spot over a long period. The 14-day SMA indicator is at $21,020, underneath the $24,065 value line of the 50-day SMA indicator. The Stochastic Oscillators have moved northward to 62.76 and 66.47 range values. It still indicates that forces to the upside are on the verge of debasing gradually around or close below the trend line of the smaller SMA.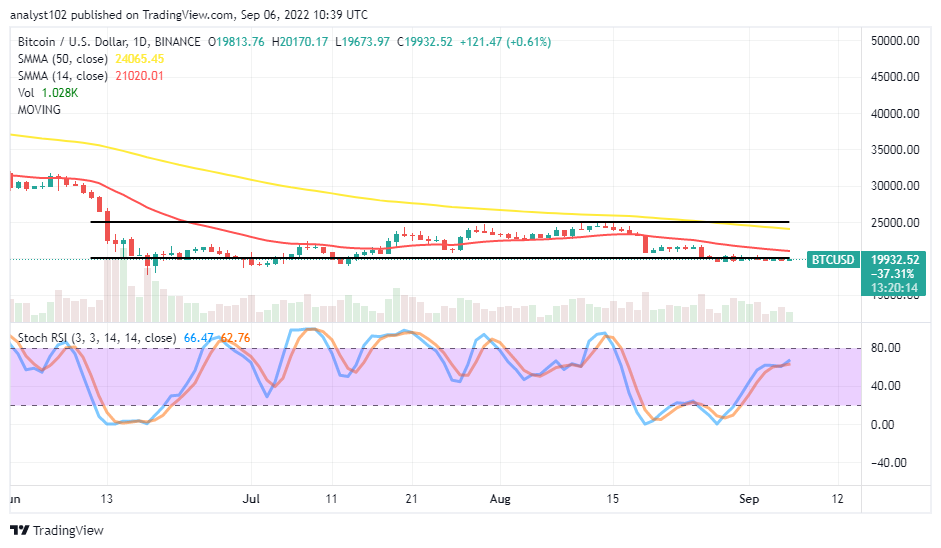
Will the BTC/USD trade direction on the north side soon?
There appears to be a less-active motion to back the BTC/USD trade activities further to the north side at the current trading capacity as the crypto-economic price hovers around the $20,000 level. Buyers are to be cautious of exerting an order even though there is a lighter bullish trading candlestick, showing a promissory upward running signal. The move can give birth to some pull-ups to test a resistance a bit over the 14-day SMA tool before losing the momentum again.
On the downside of the technical analysis, much emphasis has to be made on the resistance value point indicated by the reading of the 14-day SMA indicator at $21,020 as regards getting a signal supporting a rejection around it so that a selling entry will achieve. However, if a firm rallying move features, the price will be potentially aimed to test a higher resistance point around the 50-day SMA within the wide range-bound zones.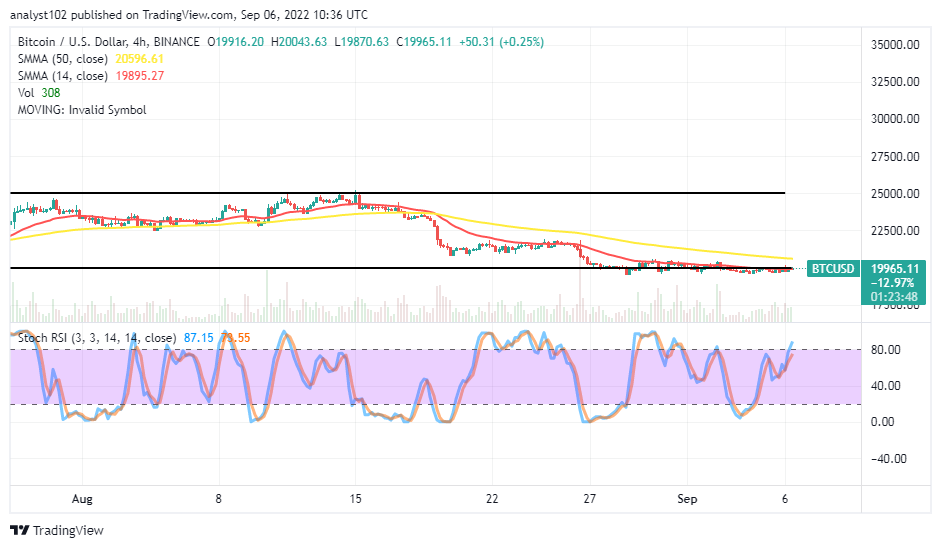
BTC/USD 4-hour Chart
The medium-term chart showcases that the BTC/USD market price hovers at the $20,000 psychological level around the trend line of the smaller SMA. The 50-day SMA indicator is at $20,596.61 over the $19,895.27 point of the 14-day SMA indicator. The Stochastic Oscillators are at the 73.55 and 87.15 ranges. The crypto economy may likely prolong its trading around the values of the SMAs.
Note: Cryptosignals.org is not a financial advisor. Do your research before investing your funds in any financial asset or presented product or event. We are not responsible for your investing results.
You can purchase Lucky Block here. Buy LBLOCK