Bitcoin (BTC/USD) Price Hovers Closer to the Level of $60,000 Resistance
Estimated Reading Time: 3 minutes
Don’t invest unless you’re prepared to lose all the money you invest. This is a high-risk investment and you are unlikely to be protected if something goes wrong. Take 2 minutes to learn more
Bitcoin Price Prediction – May 9
Over a notable number of times, the BTC/USD market has continually hovering closely below the immediate $60,000 resistance trading zone. As of writing, price is traded at about a reduction of 0.28% since it embarked on rebounding efforts.
BTC/USD Market
Key Levels:
Resistance levels: $60,000, $65,000, $70,000,
Support levels: $50,000, $45,000, $40,000
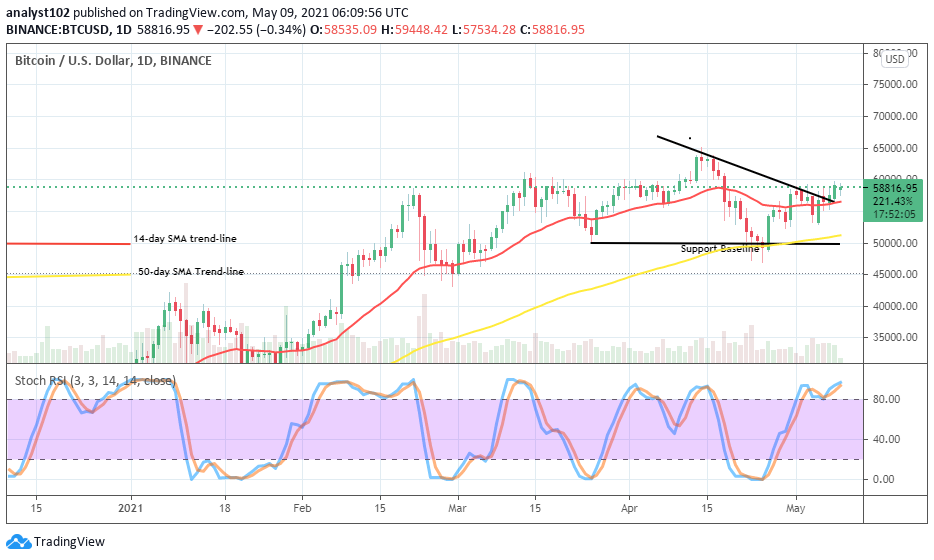
BTC/USD – Daily Chart
As it is depicted on the BTC/USD daily chart, the bearish trend-line has briefly breached to the north on May 7 to signify the degree of current buying pressure in the market. However, the key $60,000 still features as the immediate barrier line staying afloat near the current trading point. The 14-day SMA trend-line is located above the 50-day SMA indicator. And, the vital support baseline is still intact kept at the level of $50,000. The Stochastic Oscillators are in the overbought region moving in a consolidation style to affirm the possibility of much buying forces than selling in the crypto-economy.
What could be the BTC/USD market reaction in the next session?
As the BTC/USD market has managed to rally upward nearing the resistance point of $60,000, it appears that the crypto will need to hold strong by reconsolidating their stands around that point to be able to achieve a better stride away to the north. The losing of bullish momentum around the contending high zone seems not coming to play out in a near session. But, there can be a line of sideways movements for a while.
on a total contrary to all the upside sentiments of this market, bears had once had control of the market around the key point mentioned earlier. And, technically, they may as well need to always be on the lookout for any probable notable price reversal move to reconsider joining again. In the meantime, the present north move tends to continually lose momentum briefly to some sell pressures. But, a violent breakout could lead to the nullification of that sentiment.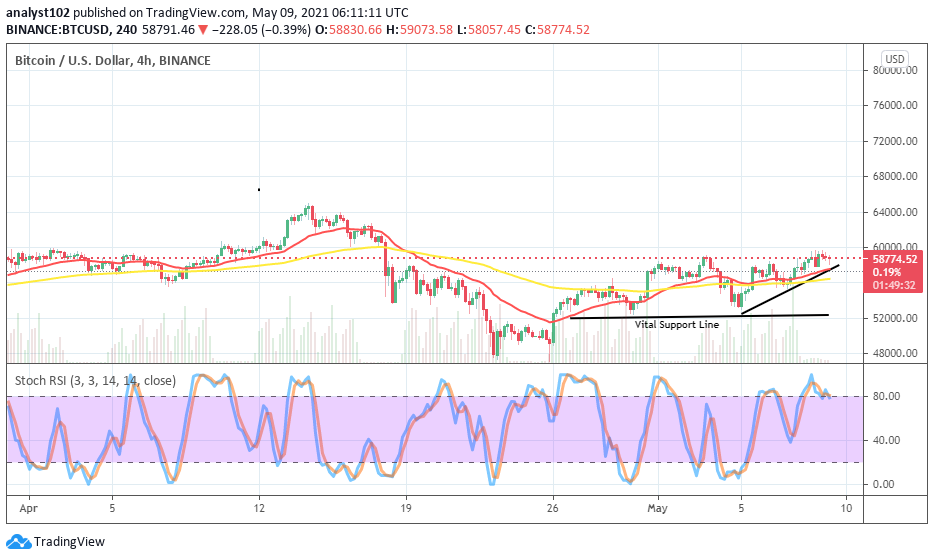
BTC/USD 4-hour Chart
The BTC/USD medium-term chart depicts a relative increase in the crypto’s market valuation as traded against the US Dollar. But, the increase in price looks like getting exhausted as it approaches the resistance of $60,000 in the near time. The 50-day SMA indicator has been placed underneath the trend-line of 14-day SMA. A short bullish trend-line on May 5, drew from a $52,000 vital support point to the north. The Stochastic Oscillators are seemingly consolidating in the overbought region. That suggests an indecisive trading situation ongoing in the business transaction pairing BTC and the US Dollar.
Note: cryptosignals.org is not a financial advisor. Do your research before investing your funds in any financial asset or presented product or event. We are not responsible for your investing results.