Bitcoin (BTC/USD) Price Manages to Push Northward
Estimated Reading Time: 3 minutes
Don’t invest unless you’re prepared to lose all the money you invest. This is a high-risk investment and you are unlikely to be protected if something goes wrong. Take 2 minutes to learn more

Free Crypto Signals Channel
Bitcoin Price Prediction – October 5
Selling forces that have surfaced below the BTC/$20,000 market psychological trading line have reduced the declining tendency as the crypto manages to push northward against the value line. The trading activities have been between $20,372.85 and $19,754.46 value points, at a minute rate of -0.58%.
BTC/USD Market
Key Levels:
Resistance levels: $22,500, $25,500, $27,500
Support levels: $17,500, $15,000, $12,500
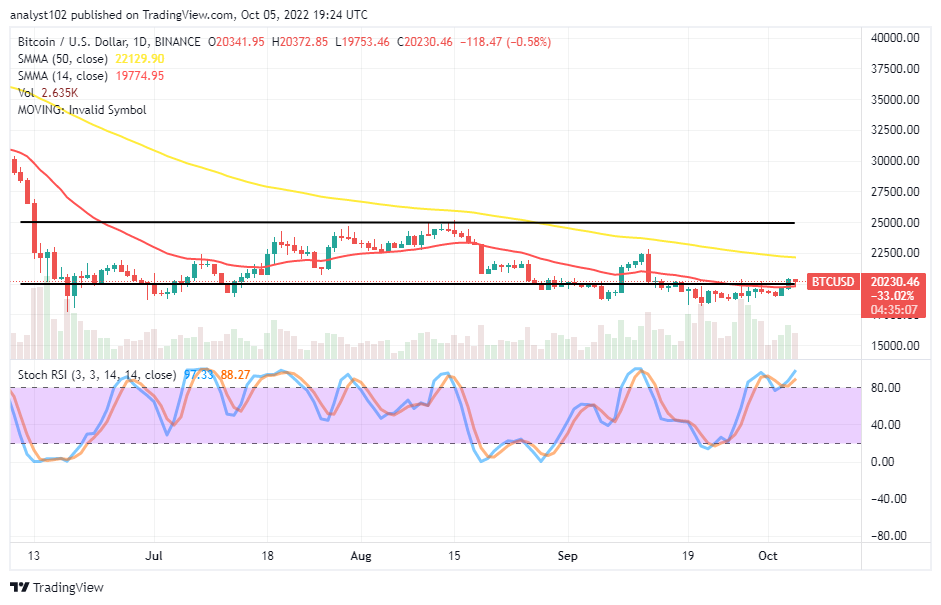
BTC/USD – Daily Chart
The BTC/USD daily chart showcases the crypto-market price manages to push northward against the $20,000 pivotal trading point. The 14-day SMA indicator is at $19,774.95, underneath the $22,129.90 value line of the 50-day SMA indicator. The lower horizontal line drew at the point mentioned earlier. The Stochastic Oscillators have crossed northbound from around the 80 range spot to maintain the range values of 88.27 and 97.33 to signify that buying pressure is ongoing.
Will the BTC/USD market lose momentum soon around the $20,000 psychological line?
The current trading capacity that the BTC/USD market maintains appears getting, weakening in a gradual moving mode as the crypto market manages to push northward against the $20,000 psychological level. The situation still suggests that long-position placers will have to allow another round of retracement before rebuilding energy from a lower-trading zone underneath the value point.
On the downside of the technical analysis, the 50-day SMA trend line remains the resistance-trading line above what the current crypto trade portends to swing upward afterward. In the meantime, the market tends to hold positions, waging for a long time around the lower horizontal line at $20,000. Short-position placers may have to adhere to a situation generated by a 1-hour time frame to determine a decent selling entry.
 BTC/USD 4-hour Chart
The BTC/USD medium-term chart reveals the crypto market manages to push northward against the lower horizontal line at the $20,000 logical level. The 14-day SMA indicator is at the $19,765.32 line, above the $19,582.75 of the 50-day SMA indicator, showing that the crypto economy has increased in valuation against the US Dollar. The Stochastic Oscillators have crossed southbound from the overbought region to reach 58.94 and 49.54 range values. And they are still pointing toward the south direction.
Note: Cryptosignals.org is not a financial advisor. Do your research before investing your funds in any financial asset or presented product or event. We are not responsible for your investing results.
You can purchase Lucky Block here. Buy LBLOCK