Bitcoin (BTC/USD) Price Moves in $65,000 and $60,000 Range Lines
Estimated Reading Time: 3 minutes
Don’t invest unless you’re prepared to lose all the money you invest. This is a high-risk investment and you are unlikely to be protected if something goes wrong. Take 2 minutes to learn more
Bitcoin Price Prediction – November 3
It is currently that the BTC/USD price moves in $65,000 and $60,000 range lines over a couple of days’ sessions. The crypto market activities trade around $63,188 at a negative percentage rate of about 0.29. Earlier on, the market recorded a lower valuation, around $62,732.
BTC/USD Market
Key Levels:
Resistance levels: $65,000, $67,500, $70,000
Support levels: $60,000, $57,500, $55,000
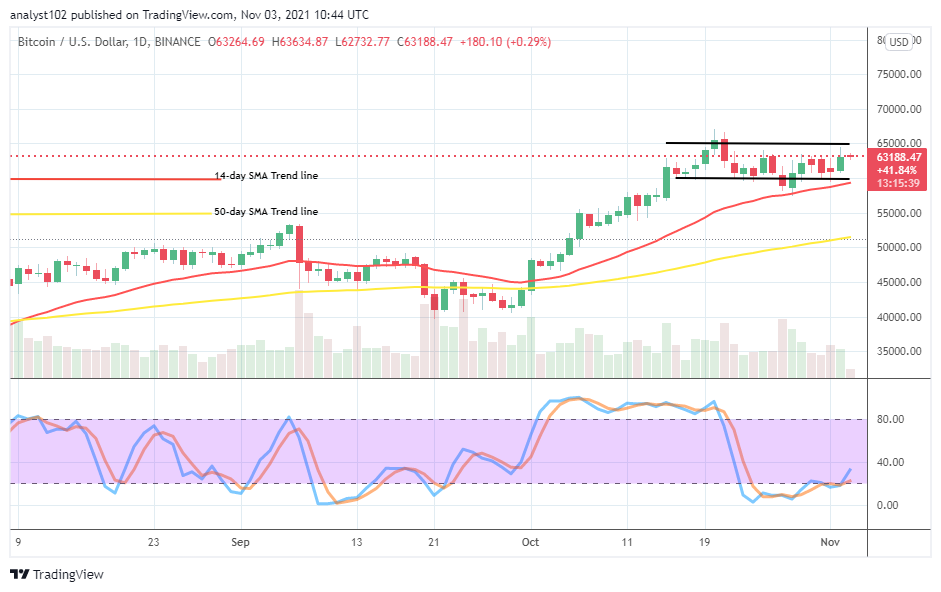
BTC/USD – Daily Chart
The BTC/USD daily chart reveals that the crypto-economic price moves in $65,000 and $60,000 range lines. The range value lines have been witnessing quite some ups and downs above the trend lines of the SMAs. The 14-day SMA indicator is above the 50-day SMA indicator. And they both slightly point to the north. The Stochastic Oscillators are consolidating, between ranges of 40 and 0. But, they now briefly open the lines toward the northbound beneath the higher range line.
As BTC/USD price moves in the $65,000 and $60,000 range lines, what could be the subsequent market direction?
Presently, a range-bound trading situation has been observed in the BTC/USD business activities as the crypto-economic price moves in $65,000 and $60,000 range lines. It would be technically okay to wait for active motions to breach out at the upper range value-line to decide whether the market will surge higher for more profits or not. The Stochastic Oscillators have indicated that the crypto trade has more upward moving advantages in the subsequent sessions.
On the downside, a repetition of price rejection has to form around the higher trading upper range line as it had happened between the trading days’ sessions of October 19 and 21. Price got resisted closely to $68,000 after breaching past $65,000. A long bearish engulfing candlestick has to occur against the current range value lines so that a selling wall will be to give decent shorting entries.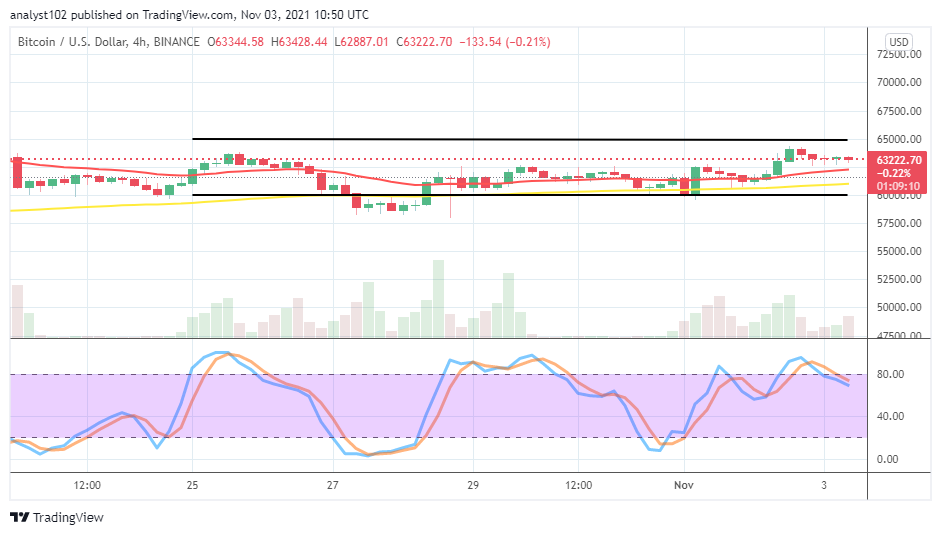
BTC/USD 4-hour Chart
The BTC/USD medium-term chart exhibits that the crypto-economic price moves in $65,000 and $60,000 range lines. The 14-day SMA trend line is above the 50-day SMA trend line as they both lay flat, pointing toward the east direction. That confirms that the market is in a range=bound trading outlook. The Stochastic Oscillators are slightly pointing to the southbound against the range of 80. That suggests that price currently faces a depression. A fearful breakout at $65,000 is expected to happen to put in the crypto’s valuation for higher profits. A violent reversal may portend the market, getting set to witness some price reductions.
Note: Cryptosignals.org is not a financial advisor. Do your research before investing your funds in any financial asset or presented product or event. We are not responsible for your investing results.
You can purchase crypto coins here. Buy Tokens