Bitcoin (BTC/USD) Price Nears Lower Range-line
Estimated Reading Time: 3 minutes
Don’t invest unless you’re prepared to lose all the money you invest. This is a high-risk investment and you are unlikely to be protected if something goes wrong. Take 2 minutes to learn more
Bitcoin Price Prediction – June 6
It appears that the BTC/USD market operations have continually featured in well-defined range-bound areas over some days. In the last few hours, the crypto’s price trades around the level of $36,000 at an average of 1.19 percent increase.
BTC/USD Market
Key Levels:
Resistance levels: $40,000, $45,000, $50,000,
Support levels: $35,000, $30,000, $25,000
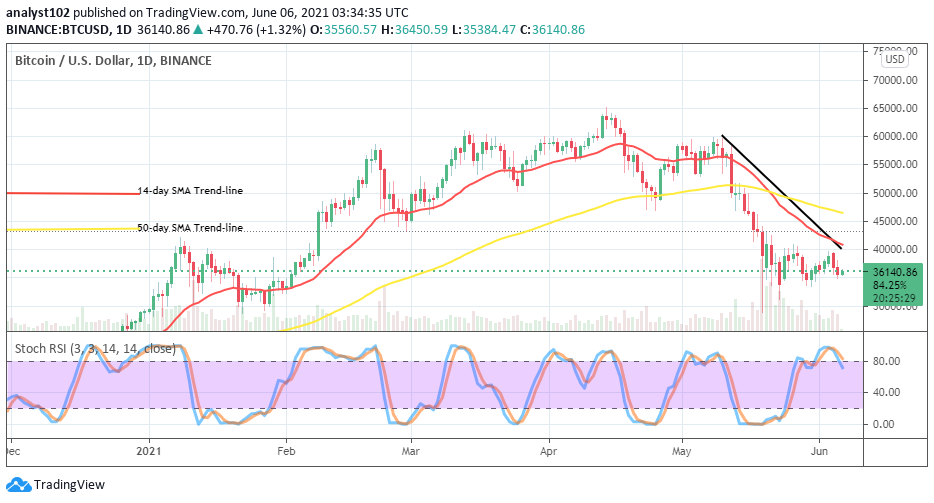
BTC/USD – Daily Chart
There now seems to be a prolonged range-bound trading situation in the market valuation that features between Bitcoin and the US Dollar as depicted on the daily chart. The usual range points remain as $40,000 and $35,000. On June 4, a notable bearish candlestick emerged closely around the upper range line and the immediate resistance value of the market. Both the bearish and the 14-day SMA trend lines are situated very close to the first resistance level underneath the 50-day SMA indicator that is located a bit over the resistance line of $45,000. The Stochastic Oscillators have slightly crossed the lines from the overbought region briefly past range 80 to the southbound to possibly indicate a retracement movement.
Will the BTC/USD market be able to push up from the lower range-line of $35,000?
As it has been closely observed that the BTC/USD market activities now near the lower range-line of $35,000 in the moving manner of retracement, it, therefore, portends that an upward move will soon play out from around the point. The lower range-line and some of the lower support levels may now be seen as good buy entries especially, while active price action is spotted resulting from a downward move.
Just like in the recent past trading sessions, the resistance level of $40,000 as it is as well considered to be the upper range-line currently in this crypto economy remains the key point adding valuable technical advantage to bears’ entry. What could eventually nullify that assumption is a sudden price break out of the area. The emergence of a full bullish-body candlestick will most likely bring about a change in the market in favor of the upside in the long run based on that.
BTC/USD 4-hour Chart
The BTC/USD 4-hour chart shows that the levels of $40,000 and $35,000 are two main points where price moves in ranges. Being as it is, the crypto market now trades around the lower range line. The bearish trend-line drew across the bigger SMA from the top to place in the middle of the range trading values. The 14-day SMA trend-line is underneath the 50-day SMA indicator as they both point toward the east direction to affirm the present range-bound trading position of the crypto market. The Stochastic oscillators are in the oversold region to suggest the possibility of getting to see an upswing in the crypto trade soon. Therefore, traders may now have to look out for a decent buy entry around the lower range-line of $36,000 with a good monitoring habit of their positions.
Note: new.cryptosignals.org is not a financial advisor. Do your research before investing your funds in any financial asset or presented product or event. We are not responsible for your investing results