Bitcoin (BTC/USD) Price Rallies Close to $50,000
Estimated Reading Time: 3 minutes
Don’t invest unless you’re prepared to lose all the money you invest. This is a high-risk investment and you are unlikely to be protected if something goes wrong. Take 2 minutes to learn more
Bitcoin Price Prediction – December 12
It observed that the BTC/USD business economic price rallies close to #50,000 after hitting a lower point near above $45,000 line during yesterday’s trading session. The crypto market is trading around $49,144 at a smaller percentage estimated at 0.80 negatives.
BTC/USD Market
Key Levels:
Resistance levels: $52,500, $55,000, $57,500
Support levels: $45,000, $42,500, $40,000
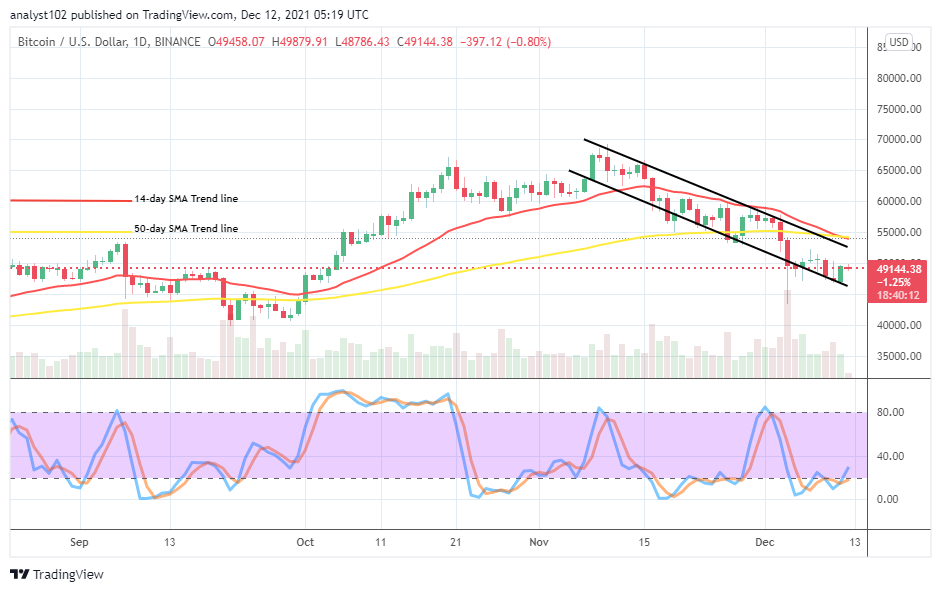
BTC/USD – Daily Chart
The BTC/USD daily chart reveals that the crypto-economic price rallies close to $50,000 after the last volatile decline on December 4. It would now be the second time for the crypto economy, rallying and trying to push past the resistance trading spot of the market value line. The 50-day SMA trend line has conjoined the 14-day SMA trend line from the top. The Stochastic Oscillators have been moving in a consolidation manner around the range of 20. That denotes some depressions ongoing in the trading activities to an extent.
Will there still be a prolongation of correction in the BTC/USD market activities as the crypto-economic price rallies close to $50,000?
In the first place, it seems that the crypto market has laid a support baseline near above $45,000 as the BTC/USD price rallies close to a resistance trading zone at $50,000 presently. Being as it is, the higher resistance level has to breach forcefully to establish ideal smooth motions to the upside in the following operations. However, the trending catalyst that is being put up by the market isn’t convincing to portend reliable buy entry presently.
On the downside of the technical analysis, the BTC/USD market short-position takers still stand the chance of pushing down the crypto valuation within the bearish channel correction trend lines especially, when it hits resistance at the upper spot. A long consolidation moving style around the $50,000 will let in return of downing motions that can bring in range-bound trading outlook around the lower level at $45,000 in the long run.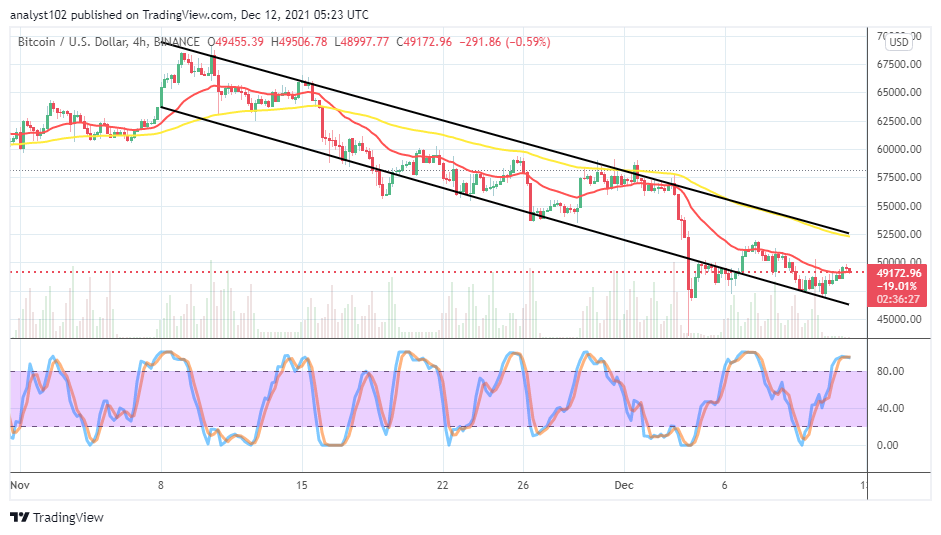
BTC/USD 4-hour Chart
The BTC/USD medium-term chart showcases that the crypto-economic price rallies close to $50,000, portending an overbought trading condition currently. The 50-day SMA indicator is above the 14-day SMA indicator. And they both still point to the southward. The Stochastic Oscillators are in the overbought region with the lines closed within. That signifies that the US economy is trying to regain its stances against the base-most expensive crypto in the world presently.
Note: Cryptosignals.org is not a financial advisor. Do your research before investing your funds in any financial asset or presented product or event. We are not responsible for your investing results.
You can purchase crypto coins here. Buy Tokens