Bitcoin (BTC/USD) Price Ranges Southward to $20,000
Estimated Reading Time: 3 minutes
Don’t invest unless you’re prepared to lose all the money you invest. This is a high-risk investment and you are unlikely to be protected if something goes wrong. Take 2 minutes to learn more

Free Crypto Signals Channel
Bitcoin Price Prediction – June 29
In the recent past, the BTC/USD market activity managed to record some smaller-swing highs before it ranges southward to the $20,000 line. Price has earlier traded around a lower value line of $19,857 at an average of 0.93 percentage rate negative.
BTC/USD Market
Key Levels:
Resistance levels: $22,500, $25,000, $27,500
Support levels: $17,500, $15,000, $12,500
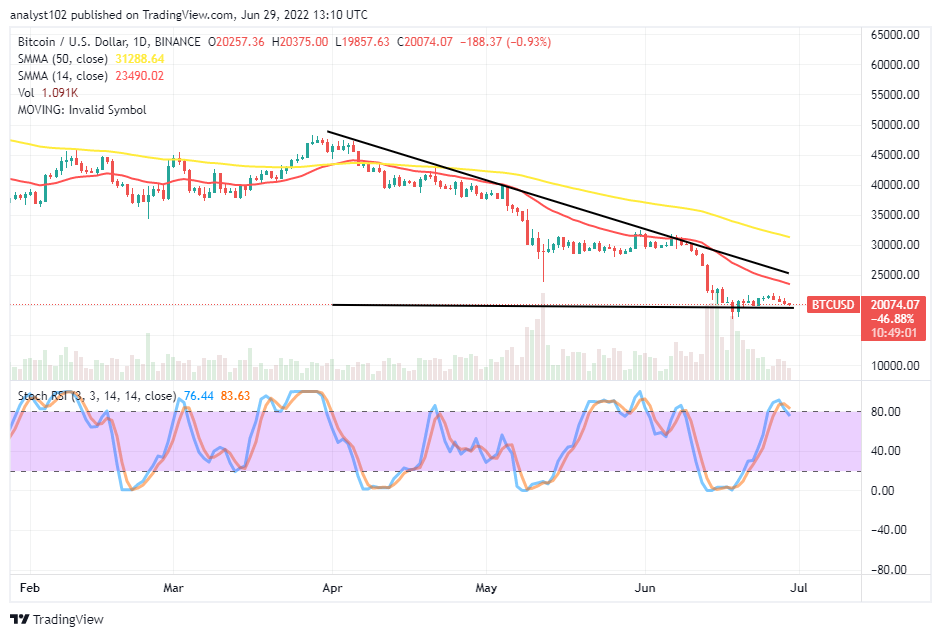
BTC/USD – Daily Chart
The BTC/USD daily chart showcases the crypto-economic price ranges southward to $20,000. The trading SMA trend lines are above the current price spot. The 50-day SMA indicator is over the 14-day SMA indicator. The bearish trend line drew southward around the smaller SMA. The Stochastic Oscillators have crossed southbound briefly from the overbought region against the 80 range. The formation of candlesticks showcases a falling force that is ongoing in a slow-and-steady moving mode.
Will the BTC/USD market lose its stance as it ranges southward presently?
There is every possibility of losing stances in the BTC/USD market operations as the crypto-economic price ranges southward to $20,000 after making variant swing highs below the trend line of the 14-day SMA. The value line stands close to the risk of getting breached to the downside. Therefore, long-position takers have to be cautious about launching a buying order at this moment. They can wait for the time that the reading of the Stochastic Oscillators will suggest a lower range spot that can suit the resumption of an upside direction before considering joining the market again.
On the downside of the technical analysis, all seem to get set in favor of selling orders. But, the forces to the downside formed gradually. The BTC/USD market sellers needed to be cautious of executing new orders below the $20,000 level. The 14-day SMA trading indicator suggests the resistance trading level at $23,490 is the key point against any probable reversal moving a motion that can emanate in no time in this crypto transaction.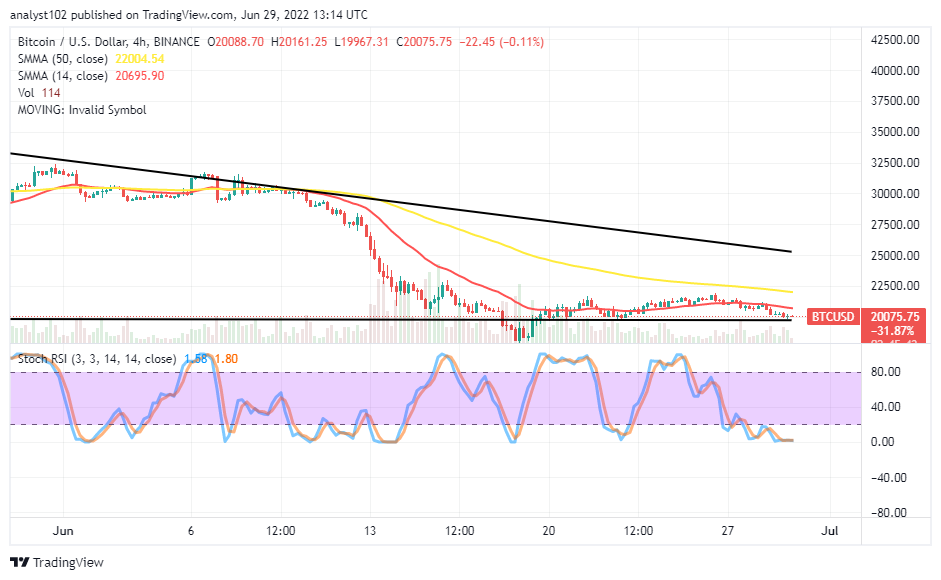
BTC/USD 4-hour Chart
The BTC/USD medium-term chart shows the crypto market price ranges southward to $20,000. The horizontal line is drawn closely beneath the trend line of the smaller SMA. The 50-day SMA indicator is above the 14-day SMA. The bearish trend line drew far above the SMAs. The Stochastic Oscillators have unwittingly moved southbound into the oversold region to indicate that a declining force is ongoing. Bears need to consolidate their moving manner around the psychological value-line mentioned earlier.
Note: Cryptosignals.org is not a financial advisor. Do your research before investing your funds in any financial asset or presented product or event. We are not responsible for your investing results.
“Lucky is up more than 50% today but still more than 430% from All Time Highs!
The opportunity to bank BIG is now!
You can purchase Lucky Block here. Buy LBlock