Bitcoin (BTC/USD) Price Runs in Lower Lows
Estimated Reading Time: 3 minutes
Don’t invest unless you’re prepared to lose all the money you invest. This is a high-risk investment and you are unlikely to be protected if something goes wrong. Take 2 minutes to learn more

Free Crypto Signals Channel
Bitcoin Price Prediction – July 3
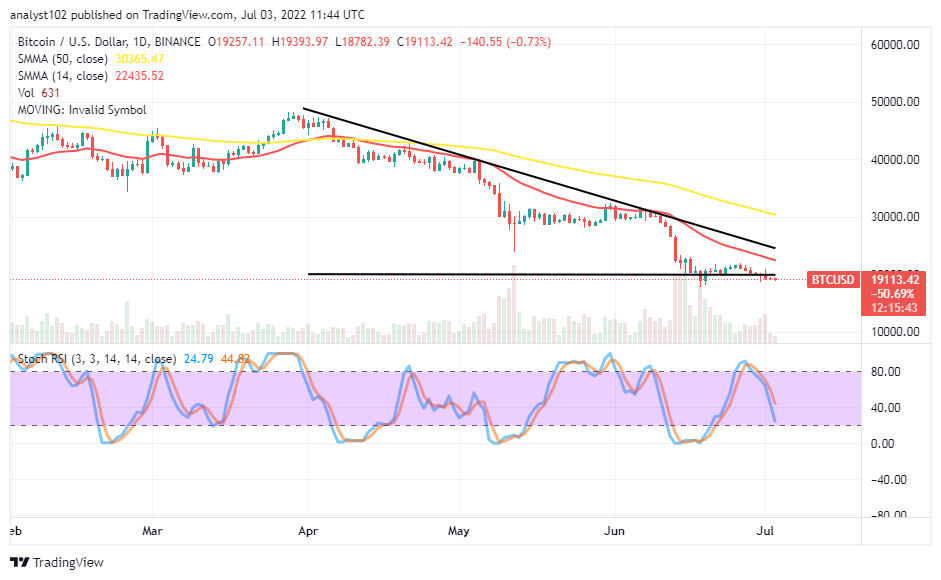
The BTC/USD market price runs at lower lows past the $20,000 trading line. In today’s session, the price has been trading between $19,393 and $18,782 at a minimal percentage rate of 0.73 negative.
BTC/USD Market
Key Levels
Resistance levels: $22,500, $25,000, $27,500
Support levels: $17,500, $15,000, $12,500
BTC/USD – Daily Chart
The BTC/USD daily chart showcases the crypto market runs in lower lows format to briefly push to the south side against the psychological point at the $20,000 level. There has now been a long-holding of the crypto economy underneath the trend line of the smaller SMA to indicate the pressures inflicted by the US Dollar still have some effects. The 14-day SMA indicator is beneath the 50-day SMA indicator. The Stochastic Oscillators have crossed southbound from the overbought region close to the range of 20.
Will the BTC/USD trade continue to feature around the $20,000 line for some more times?
The BTC/USD price’s current trading outlook suggests the possibility of featuring more around the $20,000 line as it runs in lower lows formation. The downward forces capacity appears to get a reduction in a low-moving mode. As a result of that sentiment, long-position takers would have to be alert when a rebound is due to take its course, possibly in the near time from the beneath of the value line mentioned earlier.
On the downside of the technical analysis, selling forces beneath the $20,000 psychological trading level may lack the reliable weight for sustainability. In the meantime, a declining motion is on to make the market look for ideal support before giving in to upward swings. As it is, long-term investors may consider buying into the crypto economy even if it tends to dump more diapers afterward. Price is not to push fearfully down to the $17,500 support level.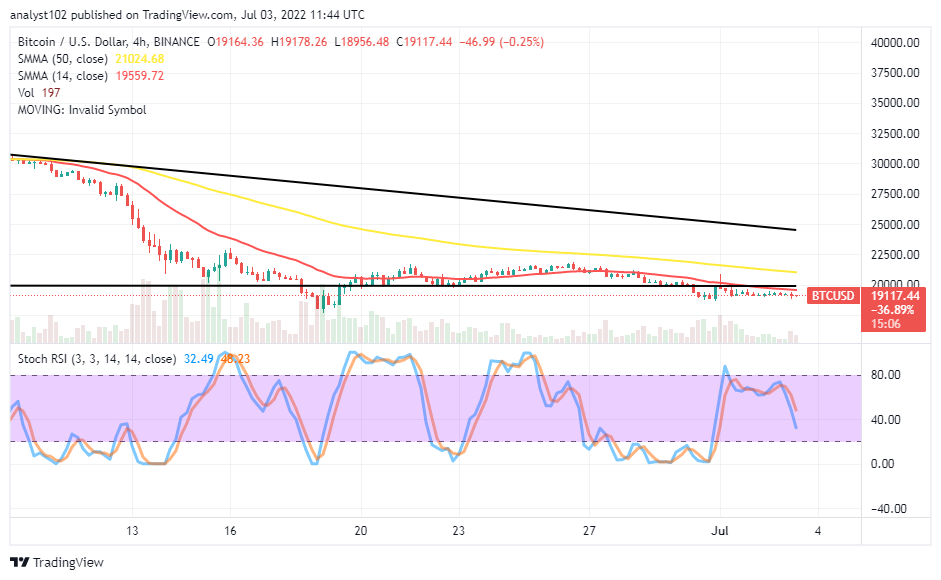
BTC/USD 4-hour Chart
The BTC/USD medium-term chart reveals the crypto-economic price runs in lower lows with traits of bullish signs closely underneath the trend line of the smaller SMA. The 14-day SMA indicator has intercepted the $20,000 psychological underneath the 50-day SMA indicator. The stochastic Oscillators have crossed southbound to touch a range around 40. It would be technically inclined to wait for a change in the reading of the Stochastic Oscillators to suggest a condition that can fine-tune returns of swing highs afterward before considering launching buying orders.
Note: Cryptosignals.org is not a financial advisor. Do your research before investing your funds in any financial asset or presented product or event. We are not responsible for your investing results.
“Lucky is up more than 50% today but still more than 430% from All Time Highs!
The opportunity to bank BIG is now!
You can purchase Lucky Block here. Buy LBlock