Bitcoin (BTC/USD) Price Trades at a Lower Range Spot
Estimated Reading Time: 3 minutes
Don’t invest unless you’re prepared to lose all the money you invest. This is a high-risk investment and you are unlikely to be protected if something goes wrong. Take 2 minutes to learn more

Free Crypto Signals Channel
Bitcoin Price Prediction – June 12
There has been a continual decline in the BTC/USD market operations as the crypto price trades at a lower range. Initially, the price dropped to a lower point of around $27,641 at a 2.82 negative percentage.
BTC/USD Market
Key Levels
Resistance levels: $32,500, $35,000, $37,500
Support levels: $27,500, $25,000, $22,500
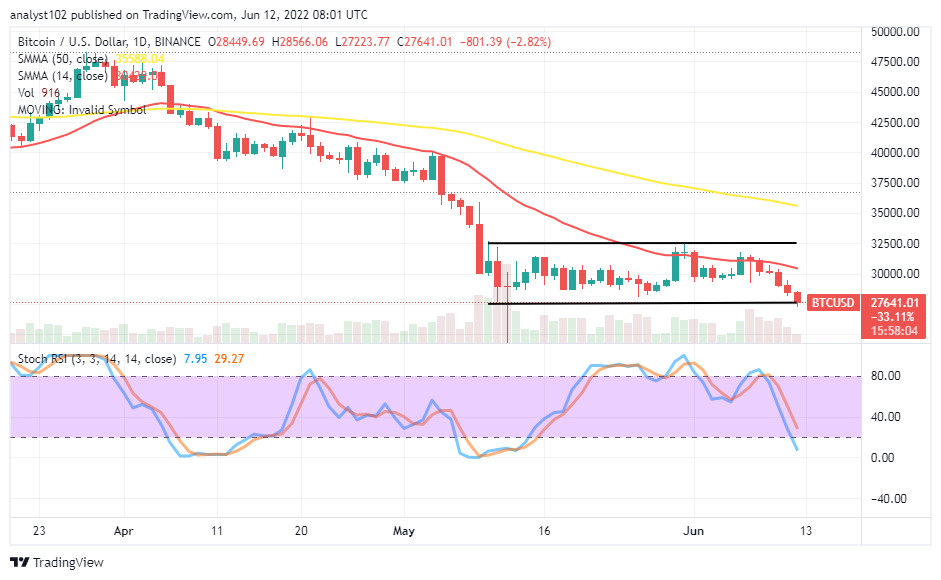
BTC/USD – Daily Chart
The BTC/USD daily chart shows the crypto’s price trades at a lower range spot of $27,500. The upper range-trading spot remains at the $32,500 resistance level. The 14-day SMA indicator bends slightly southward above the $30,000 underneath the 50-day SMA indicator, which is over the $35,000 resistance level. The Stochastic Oscillators have traveled southbound, breaking through the range at 20 into the oversold region. It portends the present situation may not quickly push back upward from getting further downs.
When will the BTC/USD find support around the lower range-trading spot?
As it has been, the BTC/USD market tends to breach further past the lower range at $27,500 if bulls remain weak to push for a rebound around the value line. Taking a long position order appears not to have a backing force around the lower range value line. Based on that, it would be psychologically ideal that buyers suspend any longing order for a while. The crypto economy may lessen into other range-bound zones lower than the current one.
On the downside of the technical analysis, the BTC/USD market sellers tend to push their positions downward past the lower range-trading level in the ongoing downward-trending motion. The full-body formed of the bearish candlestick against the lower range line could be a confirmation of seeing the subsequent trading days’ sessions witnessing more downs at the expense of bulls’ none present in the market. Bears would have to consolidate their presences around the $27,500 lower range-trading level to have sustainable breakthroughs against the lower support points in a bearish trend moving continuation bid.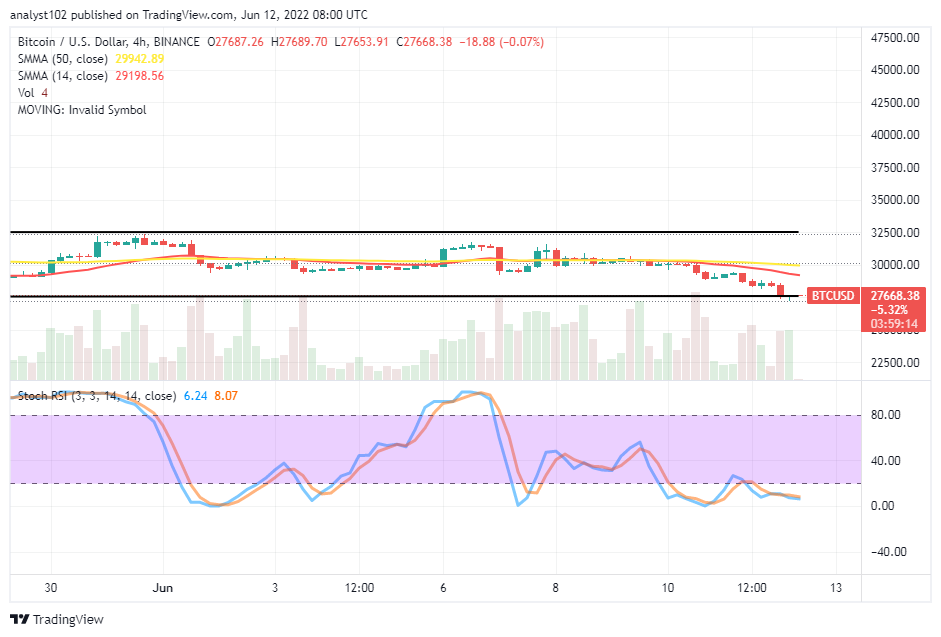
BTC/USD 4-hour Chart
The BTC/USD medium-term chart shows the crypto-economic price trades at the lower range spot. The 14-day SMA indicator has briefly intercepted the 50-day SMA indicator to the south side in the range-bound zones. The upper range line drew at the $32,500 resistance level. The stochastic Oscillators have moved southbound into the oversold region. And they are consolidating within it now to indicate the market still trades under a falling force. A long-holding of the indicator in the oversold region can elongate the strength of bears to push for more lows beneath the $27,500 lower range value-line afterward.
Note: Cryptosignals.org is not a financial advisor. Do your research before investing your funds in any financial asset or presented product or event. We are not responsible for your investing results.
“Lucky is up more than 50% today but still more than 430% from All Time Highs!
The opportunity to bank BIG is now!
You can purchase Lucky Block here. Buy LBlock