Bitcoin (BTC/USD) Price Trades in Range Lines
Estimated Reading Time: 3 minutes
Don’t invest unless you’re prepared to lose all the money you invest. This is a high-risk investment and you are unlikely to be protected if something goes wrong. Take 2 minutes to learn more
Bitcoin Price Prediction – September 29
The market operation between Bitcoin and the US Dollar now depicts that the crypto-economic price trades in range lines of $45,000 and $40,000. Over time, there have been ups and downs in the range value lines. The market’s valuation trades around the level of $42,515 with a percentage rate of about 0.83.
BTC/USD Market
Key Levels:
Resistance levels: $45,000, $47,500, $50,000
Support levels: $40,000, $37,500, $35,000
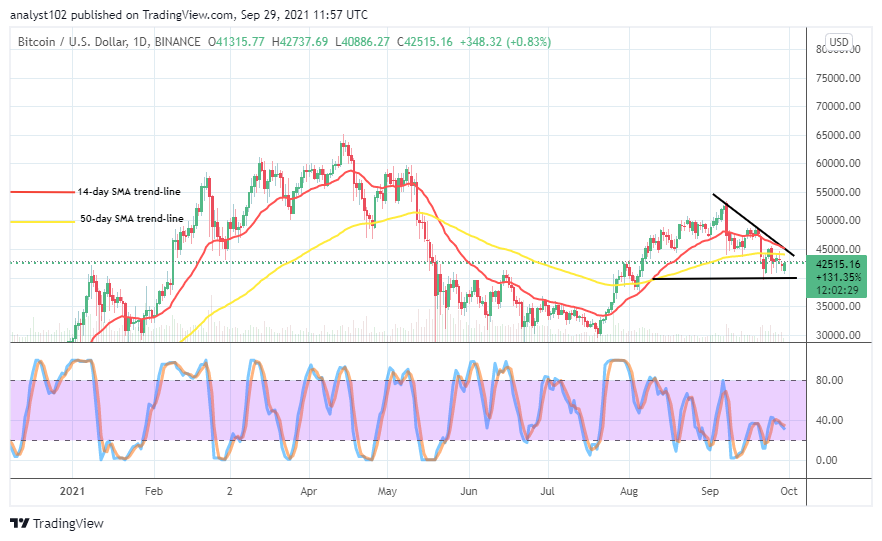
BTC/USD – Daily Chart
The BTC/USD daily chart showcases that the crypto-economic price trades in range lines of $45,000 and $40,000. It also shows that the bigger SMA was intercepted to the north by the smaller SMA around the smaller value line as it turned as the critical support baseline of the present trading situation. The 14-day SMA indicator is over the 50-day SMA indicator with the bearish trend line drawn over them, touching the psychological spots that the market keeps to the southward side. The Stochastic Oscillators have conjoined the lines at range 40, slightly pointing to the southbound. That indicates that an amount of falling force may take place in no time.
When will there be a change of trading lines as the BTC/USD market’s price trades in range lines of $45,000 and $40,000?
There will be a change of the market’s direction in the BTC/USD market while a breakout or a breakdown occurs against $45,000 or $40,000 as price trades in the range lines. In case of anything different from that assumption, there will be a continual featuring of rebounding trading conditions around the lower range value line to create better chances for the crypto market bulls to take advantage. A sudden spike at the upper range line may not come too cheaply in the near time.
On the downward trading side, the upper range line at $45,000 remains the main pivotal resistance line where selling pressures may re-surface. Several price rejections forming a line of convergences pattern around the point may as well continually give the BTC/USD market bears better advantage over bulls afterward if that there will be no either break out or breakdown out of the range lines.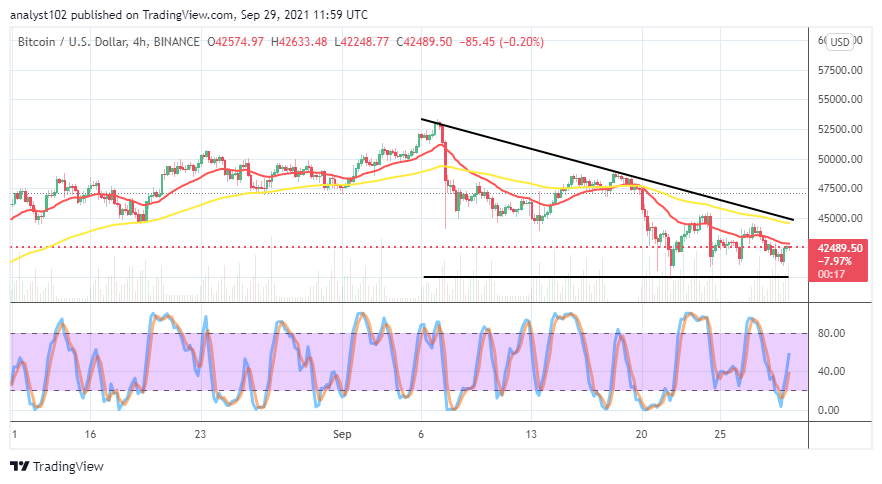
BTC/USD 4-hour Chart
The BTC/USD medium-term chart also showcases a similar trading situation that the crypto-economic price trades in range lines, featuring primarily at the mid-point of $45,000 and $40,000. The 50-day SMA indicator is over the 14-day SMA indicator. The Stochastic Oscillators are attempting to close the lines between 40 and 80. That could result in seeing another round of downs. Those presumed downs may also lead to averaging lower lines around the smaller value line to find support.
Note: Cryptosignals.org is not a financial advisor. Do your research before investing your funds in any financial asset or presented product or event. We are not responsible for your investing results.
You can purchase crypto coins here. Buy Tokens