Bitcoin (BTC/USD) Rallies Northward Strongly Against the Resistance Level of $55,000
Estimated Reading Time: 3 minutes
Don’t invest unless you’re prepared to lose all the money you invest. This is a high-risk investment and you are unlikely to be protected if something goes wrong. Take 2 minutes to learn more
Bitcoin Price Prediction – April 28
On the current note of recovery moving mood, the market valuation of BTC/USD has to intensify more efforts to rally past the resistance trading zone of $55,000 level to be able to continue its journey back to the north direction.
BTC/USD Market
Key Levels:
Resistance levels: $60,000, $65,000, $70,000
Support levels: $50,000, $45,000, $40,000
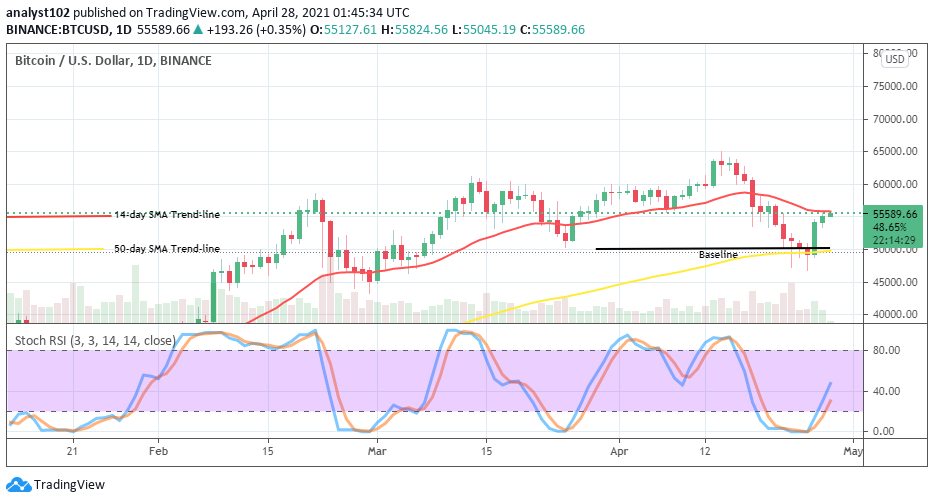
BTC/USD – Daily Chart
It is depicted on the daily trading chart that the baseline for the present recovery move in the BTC/USD market is kept intact as price continues to surge slowly to the north. The 14-day SMA trend-line is situated around the $55,000 resistance trading zone to indicate a strong point at which price needs more putting efforts to breach past to the north. The 50-day SMA indicator is at the line of $50,000 giving support to the baseline drawn of the present recovery moving bid. The Stochastic Oscillators have managed to move upward from the depth of the oversold region to place briefly past range 40 pointing towards the north. That signifies a gradual rebounding move is ongoing in the market operations between Bitcoin and the US Dollar.
Has BTC gotten the momentum to push for more recovery against the US Dollar?
It was on the financial book of records about a few trading days’ sessions that the market worth of Bitcoin as pairing with the US Dollar had to go through a kind of sell-offs that almost caused panic during the process. Now, it has turned to be the usual price correctional trading situation that the genuine market uses to encounter at a point in time. As that tends to end now, the expectation has heightened that the crypto’s worth has the potential to count against the fiat’s stance in the next sessions.
On the downside, at this point of trading time that the BTC/USD price hovers around the level of $55,000, the $60,000 resistance level may the tougher zone for bulls to breach past. And, in the case of that assumption playing out, bears may tend to rake the market advantage for a while. Meanwhile, they too have to come in on time to avoid being faked by bulls tempting effort of losing momentum at that level again as it may not that easy as it did in the past.
BTC/USD 4-hour Chart
There has been a series of lower highs denoting the pace at which the formation of variant 4-hour candlesticks is occurring on the medium-term chart. In a more distinct technical talk, the market valuation of BTC/USD now rebounds against its SMA indicators to indicate that the chief crypto is on course gradually regaining its lost momentum in the market. Price has traded reaching the 50-day SMA trend-line as the 14-day SMA trend-line is underneath it. The Stochastic oscillators are in the overbought region with closed hairs to consolidate in it. That indicates that the base trading instrument is struggling for more pushes.
Note: cryptosignals.org is not a financial advisor. Do your research before investing your funds in any financial asset or presented product or event. We are not responsible for your investing results.