Bitcoin (BTC/USD) Struggles Rallying Towards the $60,000 Resistance Level
Estimated Reading Time: 3 minutes
Don’t invest unless you’re prepared to lose all the money you invest. This is a high-risk investment and you are unlikely to be protected if something goes wrong. Take 2 minutes to learn more
Bitcoin Price Prediction – May 2
BTC/USD market line has been on a rebound-moving effort since when it found support around $50,000 during an upswing correctional movement.
BTC/USD Market
Key Levels:
Resistance levels: $60,000, $65,000, $70,000,
Support levels: $50,000, $45,000, $40,000
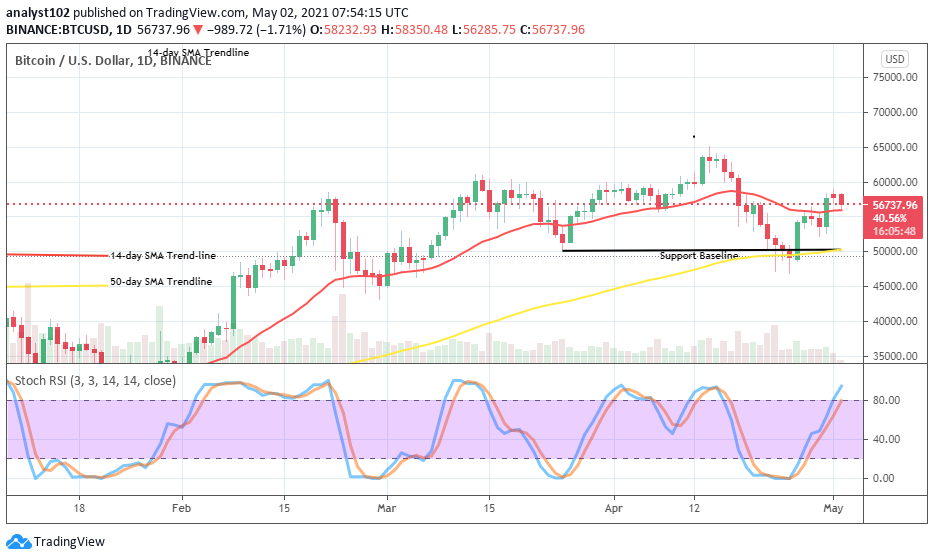
BTC/USD – Daily Chart
Some Japanese trading candlesticks have formed in the BTC/USD daily chart breaching the smaller SMA trend-line to the north to indicate a relative return of a bullish run. As of writing, the market seems to trade briefly backward the smaller SMA indicator to signify a possibility of facing a resistant situation. However, the support baseline of $50,000 is still kept together with an affirmation by the 50-day SMA indicator as the 14-day SMA trend-line is located above them closer below the current trading zone of the crypto-economy. The Stochastic Oscillators have freshly moved into the overbought region a bit over range 80. They point toward the north in a promising manner.
Will BTC/USD strengthens pushing northward in its current recovery bid?
The kind of rate of recovery-moving mood being put up by the BTC/USD bulls appears less active as the price is again facing resistance trading moment in between the $55,000 and $60,000 levels. Nevertheless, the movement to the moon is on a brighter note to carry the day in the long run. In that case, the crypto’s value may have to reverse a bit more around the level of $55,000 for a rebuilding of a stand to be able to launch back the continuity of the bullish move.
Bears have again to brace up in their muscles by rebuilding a kind of resistance in between the levels of $60,000 and $65,000 as regards analyzing the potential downturn in this market. However, a forceful breakout of those values will lighten up the technical ideology of having it that the BTC/USD market has entered a new higher trading point that will surpass the previously peak line.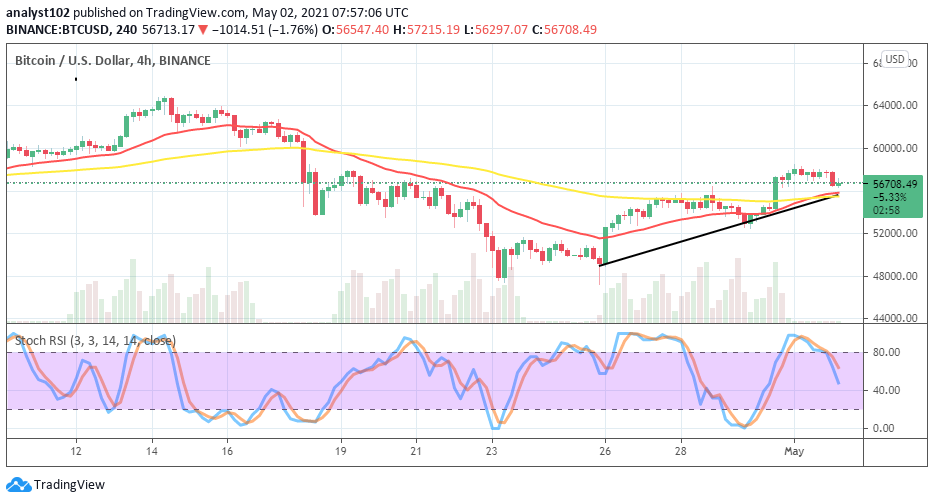
BTC/USD 4-hour Chart
On April 30, a bullish candlestick emerged breaking past the 50-day SMA indicator to the north to signal a brighter hope of the BTC’s momentum returning into the market. But, in the subsequent trading days’ sessions, a line of higher lows keeps occurring until the present to signify a low-active trading moment a bit above the $56,000 level. The 50-day SMA indicator has been conjoined from the below by the 14-day SMA trend-line along with a small bullish trend-line at the $56,000 price line. The Stochastic Oscillators have slantingly moved from the overbought region to place near range 40. That indicates a small degree of sell-offs is ongoing in the crypto-market. And, the point of $56,000 will play a crucial role in the determination of either of the two definite market directions. But, bulls are much expected to be favored afterward.
Note: cryptosignals.org is not a financial advisor. Do your research before investing your funds in any financial asset or presented product or event. We are not responsible for your investing results.